In early 2016, the stock market experienced a 10% market correction in a matter of a few weeks. It resulted in a few phone calls from clients wondering if they should move to cash. One conversation with a recent retiree really stood out for me and I wanted to share an abbreviated version of it with my readers:
Client: At the start of the year, I had $1 million invested in the market. But now it’s February and I’ve lost $100k. We’ve got to stop these losses. Please sell me out of everything and put me into cash.
Me: Would you consider staying the course a while longer? As quickly as the market can decline, it can increase just as fast.
Client: Thank you, but I still want to move to cash.
Me: How about we sell 10% of the total value of the account? That will cover your distributions for the next two to three years.
Client: No thank you. I want to be in cash now.
Me: Just one last idea – how about we move 50% of the account into cash? That will cover your distributions for 10 years. And in ten years, you can tap into your investments for your future distributions.
Client: Look, I rode out the 2008 and 2009 recession and I don’t want to have to do it again. I’d rather keep it in the bank and not have to worry about the stock market.
Me: Ok, I’ll sell everything today.
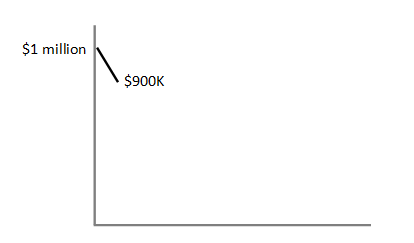
There is a lot to process in this conversation. First, the client called up believing they lost money. Between the start of the year and the day the client called, the account had declined about 10%. The sketch below shows how he visualized the loss.

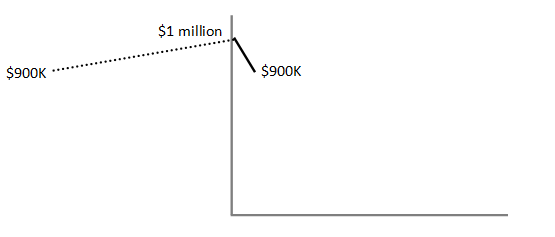
From a behavioral finance perspective, the client anchored his thinking to the high point in their portfolio. It became his frame of reference, his point of comparison. But if we looked backward and used a different reference point the story changes. We would see that his account balance is right where it was 12 months earlier:

The idea of anchoring to a high point is a common issue that behavioral economists study. We, as humans, sometimes make irrational decisions. We make decisions that we believe to be based on objective facts, but are in reality detriments in how we try to solve problems. I tried to reframe this particular client’s thinking a few different times but was unsuccessful.
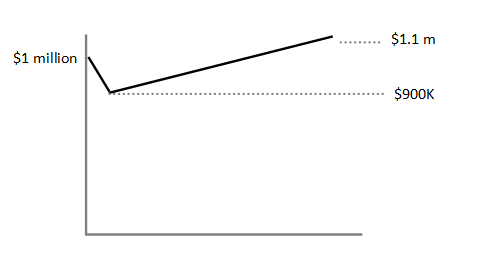
Recently, I went back and reviewed this client’s portfolio to see how he would have done if he stayed the course. As we know, the market ended up recovering and ended the year up about 10%!

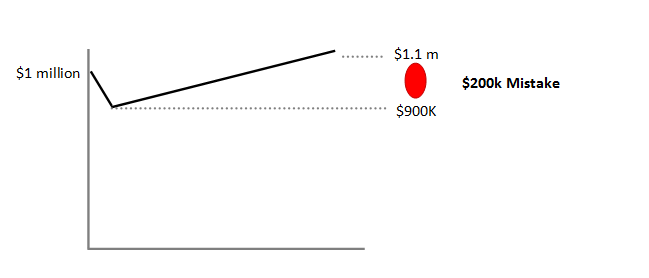
The day the client called wanting to sell out of the market ended up being the very bottom of the market “correction”. For the rest of the year, the stock market recovered from its lows in February and then began to reach new highs by the end of the year. Unfortunately, that client stayed in cash for the rest of the year. It has resulted in a $200,000 mistake!

That red circle in the sketch above represents a behavior gap. This is a well documented phenomenon in which investor decisions and behaviors are dragging down their portfolio performance (Morningstar). In this case, it could have been completely avoided or at least significantly minimized. The quick reaction to move to cash will have a lasting impact on this client, but he probably won’t notice it until his cash balance is drawn down substantially.
This serves as an example for investors to stick to their plan and avoid making sudden and drastic changes to their investment strategy… and to listen to alternative suggestions from their advisor.