Sign up with your email address to be the first to know about new products, VIP offers, blog features & more.

You are viewing Investment Behavior

How Hindsight Bias Impacts Investment Decisions

Picture this. It’s an average summer morning, except it looks a little cloudy outside. You decide to shut off the AC, open a few windows and get the fans going before you head out. On your way home from work it starts to pour. Heavily. You think….I knew it might rain, I should’ve closed the windows! Truthfully, at the time you never really knew it was going to rain, did you? Not to mention, neither did the weatherman.

This is what we call hindsight bias. We believe after a specific event occurred that we had enough knowledge to predict the event.

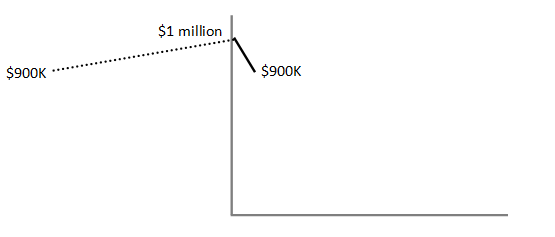
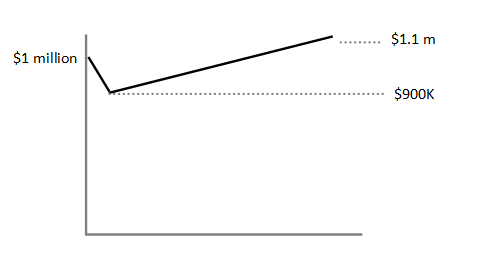
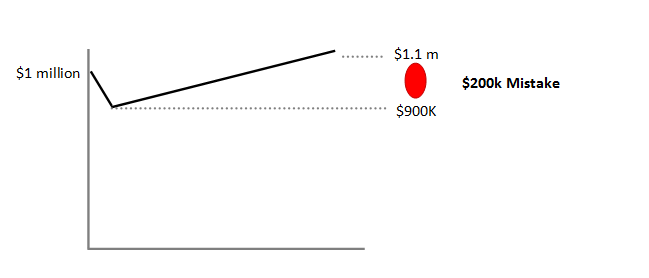
Investors develop hindsight bias by becoming reactive to any new information they receive. There is a famous story of Sir Isaac Newton who was a victim of hindsight bias. He sold out of an investment thinking he got out at the top. While all of his friends stayed invested, he watched as they double and tripled their original investment. All the while, he was kicking himself for selling out early (Hindsight bias at work). And then he famously bought back into this investment at the very top. It quickly plummeted and left him almost broke. But he didn’t learn his lesson. He went on to make a number of other poor investment decisions that left him penniless.

Why are we so susceptible to hindsight bias? Psychology tells us that humans have a need to create order. So in a way we are attempting to learn from our mistakes by oversimplifying the causes of a certain outcome. In the real world, there are too many variables to account for. Usually, we pretend like we had the knowledge to make the correct decision at the time when we really did not. This type of bias makes it difficult to learn from our past mistakes, we don’t stop and review what really occurred and why. By believing one’s ability to predict future events, an investor can develop ‘overconfidence’ while attempting to predict future events in the market. Consequences can arise when investors attempt to make informed decisions with an unrealistic view of risk leading to mediocre returns, or worse, losses.

It is important for investors to recognize this bias so they can prevent it from spoiling their judgments while making important investment decisions.

This post was written by our intern, Dan Varghese.

A Simple Strategy To Save a Million Dollars (And Why It Is So Tough)

Over the last few years, I have worked with a lot of young families to plan how they will save for retirement and fund education costs for their children.  Their problem was simple: they knew they needed to save more but they didn’t know where to trim their budget.  Or their budget was already trimmed if a spouse was staying home to raise children and they lived on one income.  They didn’t know how to get started.

One solution that I brought up was to earmark the majority of any future raises (or future income from the spouse not currently working) to be directed into savings (college, retirement, other).  On paper and in concept, it makes a lot of sense.  This post shares the experience of someone who carried out the same kind of strategy for many years.

The problem that ends up holding many people back from reaching their goal with this kind of strategy is a concept called Lifestyle Creep or Lifestyle Inflation.  This occurs when someone receives a raise and instead of immediately increasing their 401(k) contribution amount, they put it toward something to make their life more enjoyable.  It could be an improvement to the house, an extra vacation, a new car, or just eating out more frequently.  The “needs” of today end up outweighing the “needs” of tomorrow.

Turns out, there is an evolutionary reason for this mindset.  In the early days of our existence, it was feast or famine. Our ancestors adapted to their reality by consuming as much food as possible when it was available so they could survive when food was scarce.  Unfortunately, we have not yet evolved to shed that mindset from our thinking.  Short article here helps explain the concept.

The solution to this evolutionary crutch is to systematically and regularly increase savings rates.  I work with some clients where we are increasing the rate at which they save two or three times a year.  Mentally, it is easier to increase your savings rate by an extra $100/mo every few months rather than increasing the savings rate by $400/mo every year.

But even then, that solution doesn’t make up for good-old-fashion discipline.

How Prospect Theory Affects Investment Decisions

Daniel Kahneman, a 2002 Nobel memorial prize recipient in economics had stated that people might drive all the way across town to save $5 on a $15 calculator but wont drive across town to save $5 on a $125 coat. Even though the end result is the same, more people would rather save $5 on the cheaper item because they believe the significance of the amount their saving is greater.

Similarly, Richard Thaler had conducted an experiment where students were told they had just won $30. They were then offered a coin flip, where they would either win or lose $9. 70% of the students chose to do the coin flip. Other students were told they had also won $30 and then offered a different coin flip, this time they were told that after the coin flip they would either have $21 or $39. Even though there was a nine-dollar difference in both scenarios, this time only 43% of the students had to choose to do the coin flip. According to the results of this experiment, most people wont comprehend the entirety of the situation unless they are specifically told the parameters of the end result.

The average person has an entirely different attitude towards risk associating gains compared to risk associating losses. An example of this would be the joy of gaining $500 compared to the joy of gaining $1500 and then losing $1000. Even though the end results are the same, most people would prefer the gain of $500. This irrational way of viewing gains versus losses is illustrated below.


Most people will be more devastated with a loss than happy with a gain. The best way to avoid this is to understand your own risk tolerance. Before you invest into something ask yourself how much you would be okay with losing. New tools have been incorporated in how we help our clients assess their own risk tolerance by asking questions very similar to the ones that Kahneman and Thaler.

Try it for yourself


*Special thanks to Edward Butterly for his contributions to this blog post.

Gambler’s Fallacy: A Behavioral Finance Concept.

We’re having our first intern join us for the summer – Ed Butterly a senior from University of Hartford. While he is assisting me in a lot of research, I have asked him to write for the blog every time he comes across something fascinating.  It was no surprise that he gravitated toward the growing field of behavioral finance.  This new field combines psychology with economics and is causing many experts to rethink economic concepts.  What follows is Ed’s take on one of many different behavioral concepts.


If you’ve ever been to the casino and played roulette you’d understand the concept of gamblers fallacy. Gambler’s fallacy is when an individual believes that a random event is less likely to happen following an event or series of events. For example, if you were playing roulette and the ball landed on a black number 10 times in a row, you might predict that the next spin will land on red. However, this is isn’t an accurate assumption. Prior sequence’s of events does not have an effect on future events. Each spin is independent and has the same probability of landing on either color every time. Relating to this, gamblers fallacy is in the subconscious of the average investor. Many people believe that if a stock or index is increasing for a long period of time its bound to come back down eventually.

The chart above shows the past 20 years of the S&P 500. After looking at the chart, the average investor might not want to invest into a fund that tracks the S&P 500 because it’s never been this high before and they believe it’s bound to come down eventually. According to Gamblers Fallacy, the number of consecutive years of growth shouldn’t attest to future growth down the line.

One solution to overcome our tendency to fall victim to gamblers fallacy is to use a method called Dollar Cost Averaging. In dollar cost averaging you buy the stock or fund at different periods of time no matter what the price is. Here is an example of Dollar cost averaging. In this scenario an investor is buying $1000 worth of WXY stock at the beginning of every month for the next 5 months. Here are the prices at the beginning of every month.


Month 1: $50   = 20 shares

Month 2: $40   = 25 shares

Month 3: $55   = 18 shares

Month 4: $47   = 21 shares

Month 5: $58   = 16 shares


Total shares = 100, Total Cost = $5000

Average Share cost = $50, Total value of shares currently = $5800

Dollar cost averaging may reduce the risk you are taking and may lower the average share cost over time. After five months you have 100 shares of WXY stock and have spent $5000. The 100 shares are worth $5800 meaning you have made $800 in profit just by using dollar cost averaging instead of succumbing to gamblers fallacy.

But it’s important to note: This method does not ensure a profit and does not protect against loss in a declining market, so investors should consider their willingness to continue purchases during a declining or fluctuating market.

How to Plan When You Don’t Know Your Goals

Defining one’s goals isn’t easy for some people. Trying to envision what your life will look like at some point in the future can be difficult.  There are so many emotional and financial variables and so many unknowns in life that it can leave you feeling stuck or in a holding pattern until you find clarity.  We know that because it is a relatively common issue that we run into with our clients and an issue we try to help resolve for them. Retirements, illness, or the death of a family member can be very disruptive.

We help clients find clarity by trying to quantify the financial impacts of their situation and model other scenarios they are considering.

To illustrate what we do, let’s consider a typical client situation.  A couple with two college-age children have come to us looking for guidance in planning for their future.  They have very good incomes and a vacation property, but there expenses are high and they have not saved as much as they should have in the past.

Here is our process to help get this client out of their holding pattern:

  1.  We model their current financial situation and extrapolate those results out through their retirement.  Every conceivable financial variable is used to model the current situation: income expenses, accounts, assets, social security, etc.  The result is some perspective on the likelihood of maintaining the current lifestyle assuming nothing changes.  The model is summarized in a simple graphic, an example of which is below.
  2. The graphic above is presented to the client. The big circled number at the top provides a probability of success for the client to reach their financial goals.  The calculation uses Monte Carlo Simulations to imagine sequence of returns risk.  Basically, the model runs 1000 simulations to imagine how rates of returns affect a client reaching his goals.  What happens if there is a big recession early in retirement?  What happens if there is a big recession later in retirement?  What happens if the markets are flat for several years?  These are all scenarios that are modeled and considered and shows that of the 1000 simulations, 77%  result in their goals being met:
  3. In the first example above, it shows that their annual savings of $27,500 is used to successfully fund college education for two children as evident by the two green bars.  But it comes at an expense -their retirement is not fully funded as seen by the yellow bar.  This is where the conversation begins.
  4. We can begin to model changes on the fly to see how certain changes will affect their future in retirement.  In this example, the client has been wondering if they should sell their vacation property and use the savings for retirement.  We can quickly quantify the long term impact of that decision:
  5. Then we can see how that change will affect the probability of success.  We can see below that by making this one change, we have increased the probability of success from 77% to 93%.
  6. Sometimes, this gives the client enough clarity to make a decision and move on.  But that’s not always the case.  After the client has thought about making a major decision (such as selling a vacation home), they may come back saying they can not actually sell their vacation property and need to consider other options.  Below is a comparison of their current situation compared to a scenario in which they delay retirement for two more years.  The result is almost the same as if they sold the vacation property.

After this exercise, the client has two viable options to consider to get them on track for retirement.  By seeing certain scenarios modeled, it can make possible decision more real to them and hopefully more achievable.  The illustration we provide help them make better decisions.

There are lots of emotional decisions that revolve around major life decisions, like retiring, changing jobs/careers, and moving.  We believe that by addressing the financial impacts of these decisions, we can affect the emotional considerations that may be holding our clients back.  Our goal is to provide that nudge to get them moving in the right direction and to keep them from making mistakes.

If you feel like you are stuck or need help laying a clear path forward, please reach out to us:


A $200,000 Mistake

In early 2016, the stock market experienced a 10% market correction in a matter of a few weeks.  It resulted in a few phone calls from clients wondering if they should move to cash.  One conversation with a recent retiree really stood out for me and I wanted to share an abbreviated version of it with my readers:

Client:  At the start of the year, I had $1 million invested in the market.  But now it’s February and I’ve lost $100k. We’ve got to stop these losses.  Please sell me out of everything and put me into cash.

Me: Would you consider staying the course a while longer?  As quickly as the market can decline, it can increase just as fast.

Client: Thank you, but I still want to move to cash.

Me: How about we sell 10% of the total value of the account?  That will cover your distributions for the next two to three years.

Client:  No thank you.  I want to be in cash now.

Me: Just one last idea – how about we move 50% of the account into cash?  That will cover your distributions for 10 years.  And in ten years, you can tap into your investments for your future distributions.

Client:  Look, I rode out the 2008 and 2009 recession and I don’t want to have to do it again.  I’d rather keep it in the bank and not have to worry about the stock market.

Me:  Ok, I’ll sell everything today.


There is a lot to process in this conversation.  First, the client called up believing they lost money.  Between the start of the year and the day the client called, the account had declined about 10%.  The sketch below shows how he visualized the loss.

From a behavioral finance perspective, the client anchored his thinking to the high point in their portfolio.  It became his frame of reference, his point of comparison. But if we looked backward and used a different reference point the story changes.  We would see that his account balance is right where it was 12 months earlier:

The idea of anchoring to a high point is a common issue that behavioral economists study.  We, as humans, sometimes make irrational decisions.  We make decisions that we believe to be based on objective facts, but are in reality detriments in how we try to solve problems.  I tried to reframe this particular client’s thinking a few different times but was unsuccessful.

Recently, I went back and reviewed this client’s portfolio to see how he would have done if he stayed the course.  As we know, the market ended up recovering and ended the year up about 10%!

The day the client called wanting to sell out of the market ended up being the very bottom of the market “correction”. For the rest of the year, the stock market recovered from its lows in February and then began to reach new highs by the end of the year.  Unfortunately, that client stayed in cash for the rest of the year.  It has resulted in a $200,000 mistake!

That red circle in the sketch above represents a behavior gap.  This is a well documented phenomenon in which investor decisions and behaviors are dragging down their portfolio performance (Morningstar). In this case, it could have been completely avoided or at least significantly minimized.  The quick reaction to move to cash will have a lasting impact on this client, but he probably won’t notice it until his cash balance is drawn down substantially.

This serves as an example for investors to stick to their plan and avoid making sudden and drastic changes to their investment strategy… and to listen to alternative suggestions from their advisor.