We’re having our first intern join us for the summer – Ed Butterly a senior from University of Hartford. While he is assisting me in a lot of research, I have asked him to write for the blog every time he comes across something fascinating. It was no surprise that he gravitated toward the growing field of behavioral finance. This new field combines psychology with economics and is causing many experts to rethink economic concepts. What follows is Ed’s take on one of many different behavioral concepts.
If you’ve ever been to the casino and played roulette you’d understand the concept of gamblers fallacy. Gambler’s fallacy is when an individual believes that a random event is less likely to happen following an event or series of events. For example, if you were playing roulette and the ball landed on a black number 10 times in a row, you might predict that the next spin will land on red. However, this is isn’t an accurate assumption. Prior sequence’s of events does not have an effect on future events. Each spin is independent and has the same probability of landing on either color every time. Relating to this, gamblers fallacy is in the subconscious of the average investor. Many people believe that if a stock or index is increasing for a long period of time its bound to come back down eventually.
The chart above shows the past 20 years of the S&P 500. After looking at the chart, the average investor might not want to invest into a fund that tracks the S&P 500 because it’s never been this high before and they believe it’s bound to come down eventually. According to Gamblers Fallacy, the number of consecutive years of growth shouldn’t attest to future growth down the line.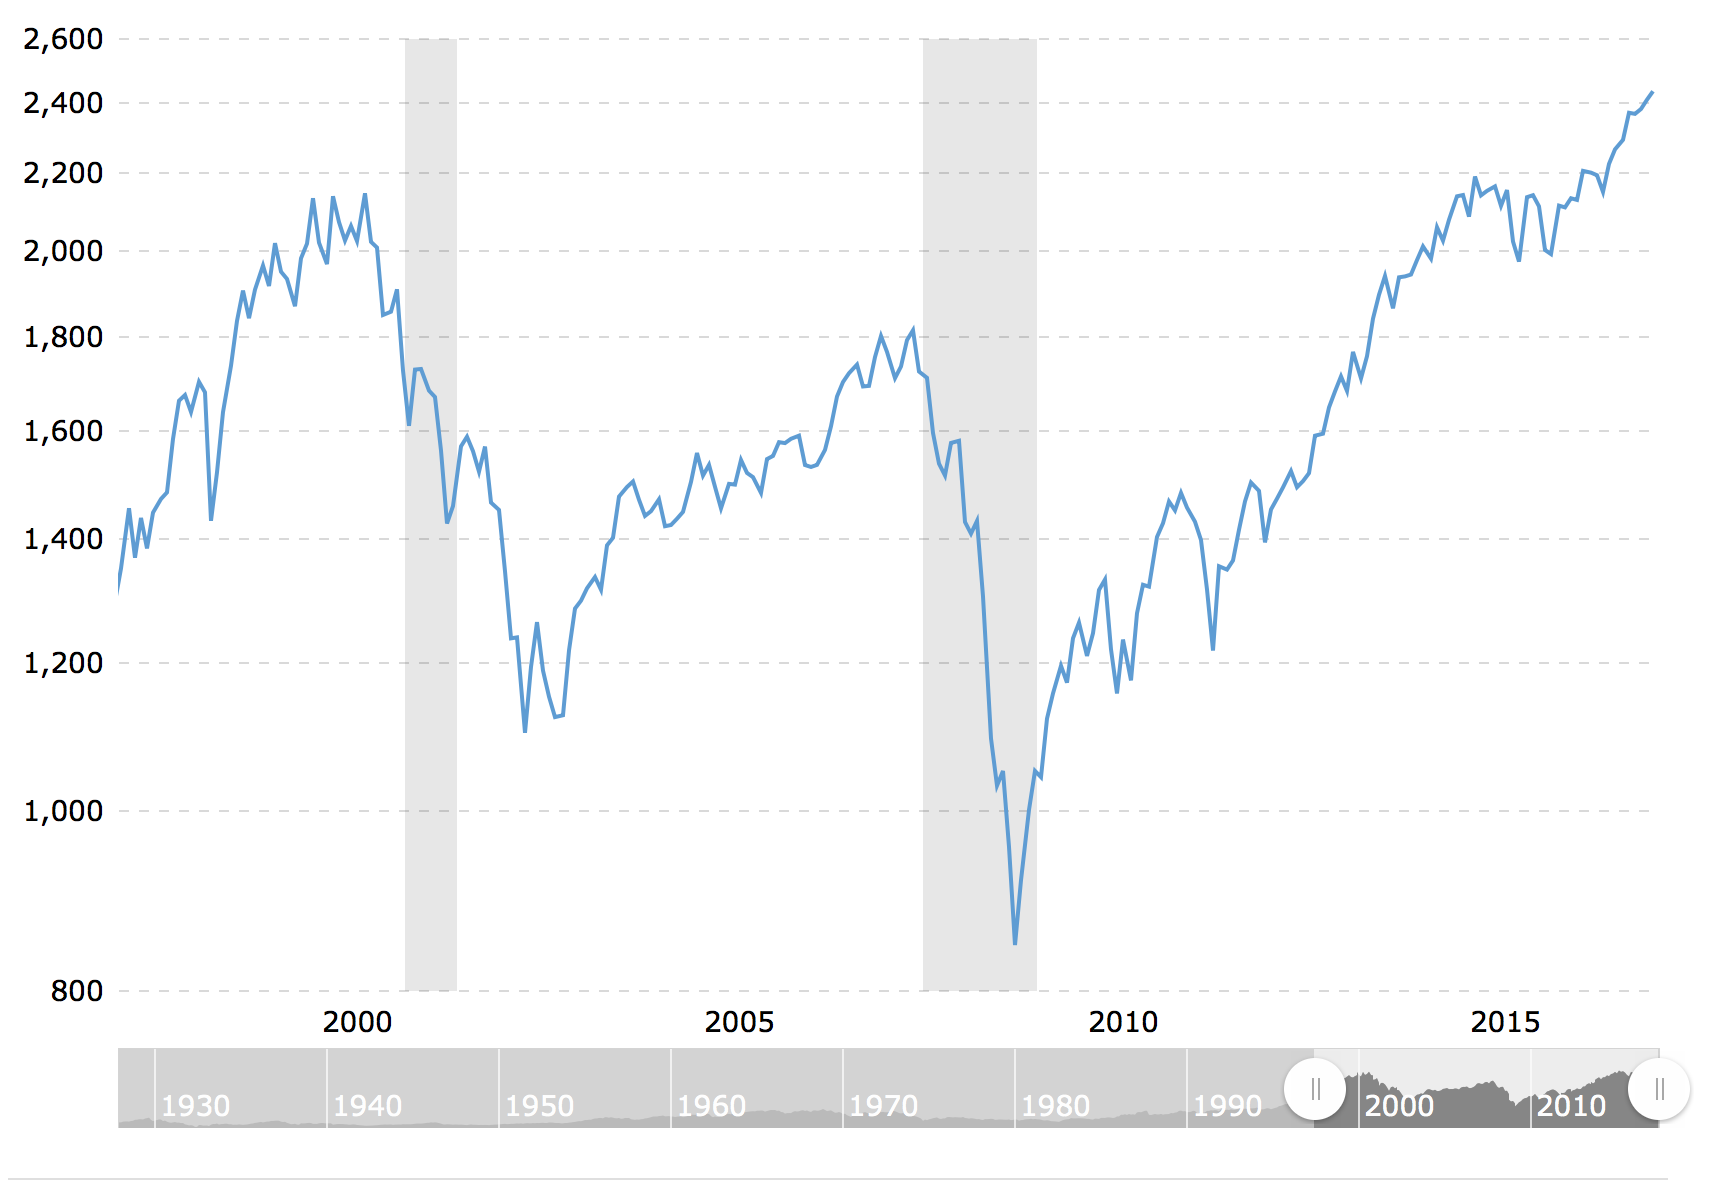
One solution to overcome our tendency to fall victim to gamblers fallacy is to use a method called Dollar Cost Averaging. In dollar cost averaging you buy the stock or fund at different periods of time no matter what the price is. Here is an example of Dollar cost averaging. In this scenario an investor is buying $1000 worth of WXY stock at the beginning of every month for the next 5 months. Here are the prices at the beginning of every month.
Month 1: $50 = 20 shares
Month 2: $40 = 25 shares
Month 3: $55 = 18 shares
Month 4: $47 = 21 shares
Month 5: $58 = 16 shares
Total shares = 100, Total Cost = $5000
Average Share cost = $50, Total value of shares currently = $5800
Dollar cost averaging may reduce the risk you are taking and may lower the average share cost over time. After five months you have 100 shares of WXY stock and have spent $5000. The 100 shares are worth $5800 meaning you have made $800 in profit just by using dollar cost averaging instead of succumbing to gamblers fallacy.
But it’s important to note: This method does not ensure a profit and does not protect against loss in a declining market, so investors should consider their willingness to continue purchases during a declining or fluctuating market.