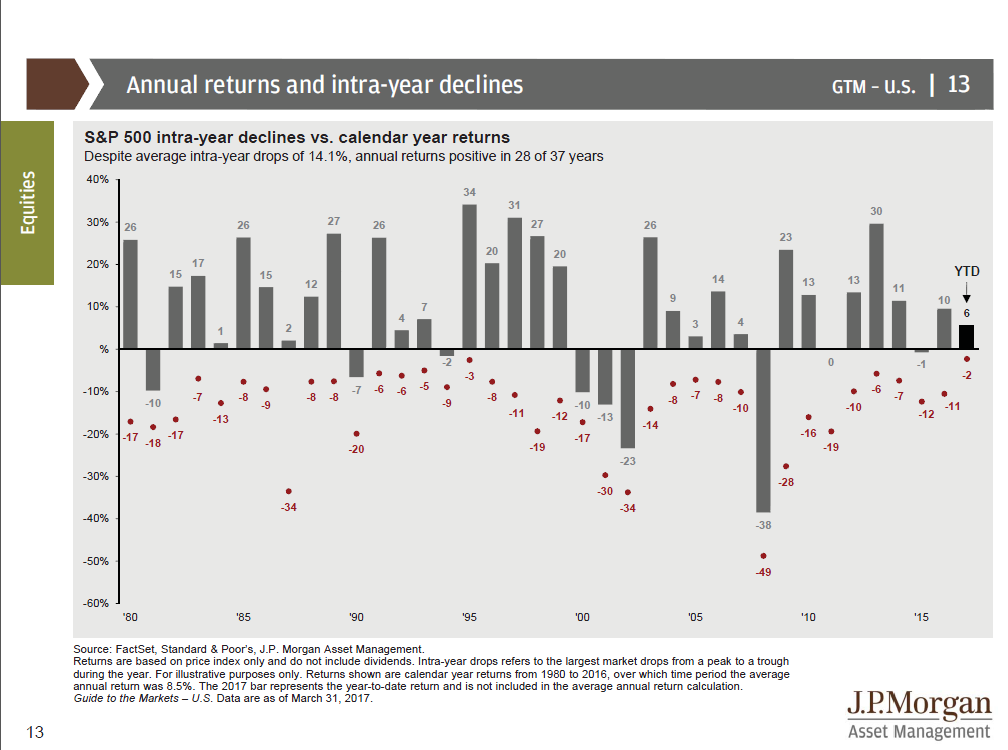
Here is an interesting chart I came across that shows just how volatile the stock market can be during the year. In a year where we have seen relatively little downside volatility in the market, it’s important to remember that there can be some big and sometimes scary corrections in the market.
This chart shows the calendar year returns in grey bars for the S&P 500. But the interesting take away are the red dots that show the intro-year decline of the index. Look at 2016, which ended the year up 10%, but was down as much as 11%.
Those “shocking” market corrections and big declines that lead investors to make bad decisions are not unusual. They are just really scary when we are in the midst of a correction.