Sign up with your email address to be the first to know about new products, VIP offers, blog features & more.

You are viewing Economy

Bonds: The Long and Short of It

Bond funds are often lumped together as one.  However, they are actually a range of very different investments.  This post will address only investment-grade bond funds which have a low probability of default as these are bonds that are issued by large and established corporations and the U.S. government.

It is important to know how changing interest rates affect short-term and long-term bond funds differently.  Short-term bond funds hold individual bonds that mature and ‘roll’ quickly into new bonds with current interest rates. This means short-term bond funds adjust relatively quickly to changing interest rates, so the principal risk is relatively low.   Short-term interest rates are set by our Central Bank as policy.  Long-term rates, however, are set by market forces and investor expectations.  Our Central bank influences, but does not control long-term interest rates. The interest rates on long-term bonds do not change for the length of their maturity.  What must adjust to changes in interest rates is the current price of the bond.  Higher interest rates mean lower current bond prices and vice versa (refer to my posts on duration).

What is important to know for today’s investors is that the Federal Reserve has raised short-term interest rates meaningfully off of zero over the last year or so and plans on continuing this trend.  As a result, some short-term investment grade bond funds are now offering SEC yields of around 2.5%.  However, long-term interest rates have only risen somewhat and, as a result, long-term investment grade bonds are offering an SEC yield of only 3 to 4%.  It was expected that long-term interest rates would rise accordingly with short-term rates, but thus far they have not.  Should this change, there is a real potential that longer-term interest rates will rise and the price of long-term investment grade bonds funds would be negatively impacted.

Investing in short-term investment grade bonds may currently have a lower dividend, but offer less principal risk.
Buybacks Drive Stocks Higher

The tax cuts that went into effect this year lowered the corporate tax rate from 35% to 21%. Of course, most corporations were not paying that, the effective rate that was actually paid was much lower. However, the new lower 21% official rate allowed corporations to lower their effective rate even further and boost earnings. Also of great importance, it allowed for bringing overseas earnings back home for a limited time at a substantially reduced tax rate. While the goal of this ‘bring the money home’ legislation was to increase investments in plants, equipment, and jobs (which is happening) much of the cash is going to stock buybacks.

Stock buybacks are driving the stock market higher. Corporations are buying shares in the open market creating demand and driving prices higher. Additionally, when corporations buy their own shares they ‘retire’ these shares leaving fewer shares outstanding. Each remaining outstanding share then represents a larger piece of the corporation. Therefore, when total earnings are reported, a smaller number of shares are divided into them. This increases earnings per share and further boosts share price.

Unlike paying out dividends to shareholders, buybacks do not involve immediate taxation. Dividends are taxed up to 20% while buybacks can result in meaningful capital gains in share price which will only be taxed when they are eventually sold. Buybacks can be a very positive way to reward shareholders with earnings in excess of what the underlying corporation needs to finance ongoing business plans.

So far this year, buybacks are running at a record pace.

Furthermore, and not quite as positive, several years of ultra-low interest rates have encouraged corporations to borrow money to buy back shares. This has resulted in record levels of debt carried by U.S. corporations. While stock buybacks help boost share price in the short run, this incurred debt may be problematic over the long run as more and more money is going towards interest payments. This leaves less for ongoing business needs, especially in recessionary times.

While there is no equation to forecast the effect of buy backs on future share prices, it continues to be a very strong positive in the short run.

Stock Market Update

For the first time in close to two years, the stock market is spooking investors. The decline was swift, sudden and unexpected.  It caught many people completely off guard.  A lot of the headlines I read over the weekend, yesterday and this morning were written to evoke more fear.  I’ve pulled together a few good quotes and excerpts to help put recent market events in perspective:
  1. “Don’t be scared, and don’t be impulsive. Be disciplined no matter what the market environment, and keep saving and investing according to your long-term plan,”  Kristin Hooper, chief global strategist at Invesco. Source
  2. “We are reminding clients to keep this in perspective and look to be proactive not reactive to the markets at this time. It is a big emotional test of…risk tolerance; we all want the upside but remember there is downside risk and goals, risk tolerance and time frames must always lead one’s investment decisions.”  Jeff Carbone, Managing Partner of Cornerstone Wealth. Source
  3. On average, there’s been a market correction every year since 1900… Instead of living in fear of corrections, accept them as regular occurrences. Source
  4. What’s more, the abnormal smoothness of the stock market over the past couple of years set investors up for a shock whenever stocks did fall at least 5%, as they did on Monday. As I pointed out last month, in the low-volatility market we’ve seen until recently, “even slight declines are apt to set off talk of Armageddon, and you will need to focus harder than ever on long-term returns to keep short-term losses from rattling you.” Source
  5. The Dow is down -0.4% year to date.  Source
  6. And then some people are selling because they aren’t people at all, but software programs that have been programmed to sell when others are selling. Source
  7. Losses — as in the Dow falling a little more than 7% over the past two trading sessions (including its biggest point drop ever on Monday) — loom larger than corresponding gains, according to those who study behavioral economics. In other words, losing 7% of your money hurts twice as much [as the pleasure of] making 7%. So, it’s normal, it’s human nature, that you’re in panic mode. But don’t act on your panic. Or at least don’t panic sell. Source
  8. “If investors were happy with their asset allocation on Thursday, they should find stocks more attractive today. Of course, investors sometimes are asleep at the wheel and a periodic wake-up call can be useful, but prices are just back to where they were a couple weeks ago, so why panic?,” Source
  9. We’ve had 15 straight months without a monthly loss in U.S. equity markets. Source
  10. The 665-point decline in the Dow Jones Industrial Average on Friday was the largest since June 2016. However, back in 2016, the Dow declined about 5%, and Friday’s drop was 2.5%. Source
  11. And while Monday’s drop was the biggest point drop ever, it still pales in comparison to the largest daily percentage losses: On Oct. 19, 1987, the Dow fell 22.61% and on Oct. 28, 1929 the Dow fell 12.82%. By contrast, Monday’s drop was 4.6%. Source
Still looking for some more perspective?  Consider reading this article written by CNBC a few years ago.
We are closely watching the situation and will act accordingly as the events continue to unfold.

The Usefulness of Market Outlooks

“Who knows” was my answer when I was recently asked about my own outlook on the markets for 2018.

Over the last few weeks, my inbox has been flooded by dozens if not a hundred market outlooks by prominent research firms, economists, and strategists.  And they are all completely different.  Some see significant stock market appreciation while others see little to no growth. Some see more growth in the US than abroad.  Others see more growth in the foreign markets than in the US.  Some see rising rates to be an issue.  Others do not.  And some even predict a negative year for the stock market. Chances are they are all wrong!

They are interesting to skim through to understand what they believe are the biggest issues to occur in 2018.  But it’s just as fascinating to see what is not included in their outlooks.  There are even some research groups that make a living by reading through old Market Outlooks and calling out all the wrong predictions.

Think back to this time last year.  Trump was just sworn into office and it seemed like everyone was waiting for some kind of market correction to occur.  But it didn’t!  Volatility is now way down.  Markets have shrugged off much of the bad news that has come out in recent months (such as North Korea).  Any market outlook that expressed these kinds of views would have been quickly dismissed if written in early 2017.

It’s a reminder to stay focused on your investment strategy.  There is a lot of noise that distracts investors and all to0 often leads them into making poor investment decisions.

Earnings

I thought I would do a review of recent earnings of the S&P 500.

Recall that earnings* for the 500  largest U.S. companies, the S&P 500,  are reported in two ways.  The first is GAAP (Generally Accepted Accounting Principles) earnings. This number is the one that is reported to the SEC. The second is operating or non-GAAP earnings. The non-GAAP earnings are what analysts follow because it adjusts for one-time events and is said to more actually reflect their business.

For the 2nd quarter of 2017 which just ended, blended earnings are coming in at about $104 (GAAP) earnings and about $116 (operating)earnings; the latter is almost always higher as companies can exclude items they do not like to report.  This is up from $87 (GAAP) earnings and $115 (operating) earnings for the 4th quarter of 2015 which were low, in part, due to the hit energy companies took when oil prices crashed. In the 3th quarter of 2014 earnings came in at $106 (GAAP) and $115 (operating).  Earnings have recovered to their previous peak reached several years ago while the market has moved higher.

This puts the Price/Earnings ratio** of the S&P 500 at 24x’s (GAAP) and 22x’s (operating). The long-term average Price/Earnings ratio is about 15x’s earnings, which is closer to what I have labeled “fair value” in previous entries (see below).

*all earnings are Trailing Twelve Months (TTM)

**The Price/Earnings ratio compares a stock’s 12-month trailing earnings to the current price.

What Drives the Cost of College

With all of our clients who have children, planning for college expenses is the one of the biggest concerns that keeps them up at night.  Retirement planning may be a bigger issue in the long term, but the children will be going to college a lot sooner than their parents will retire.

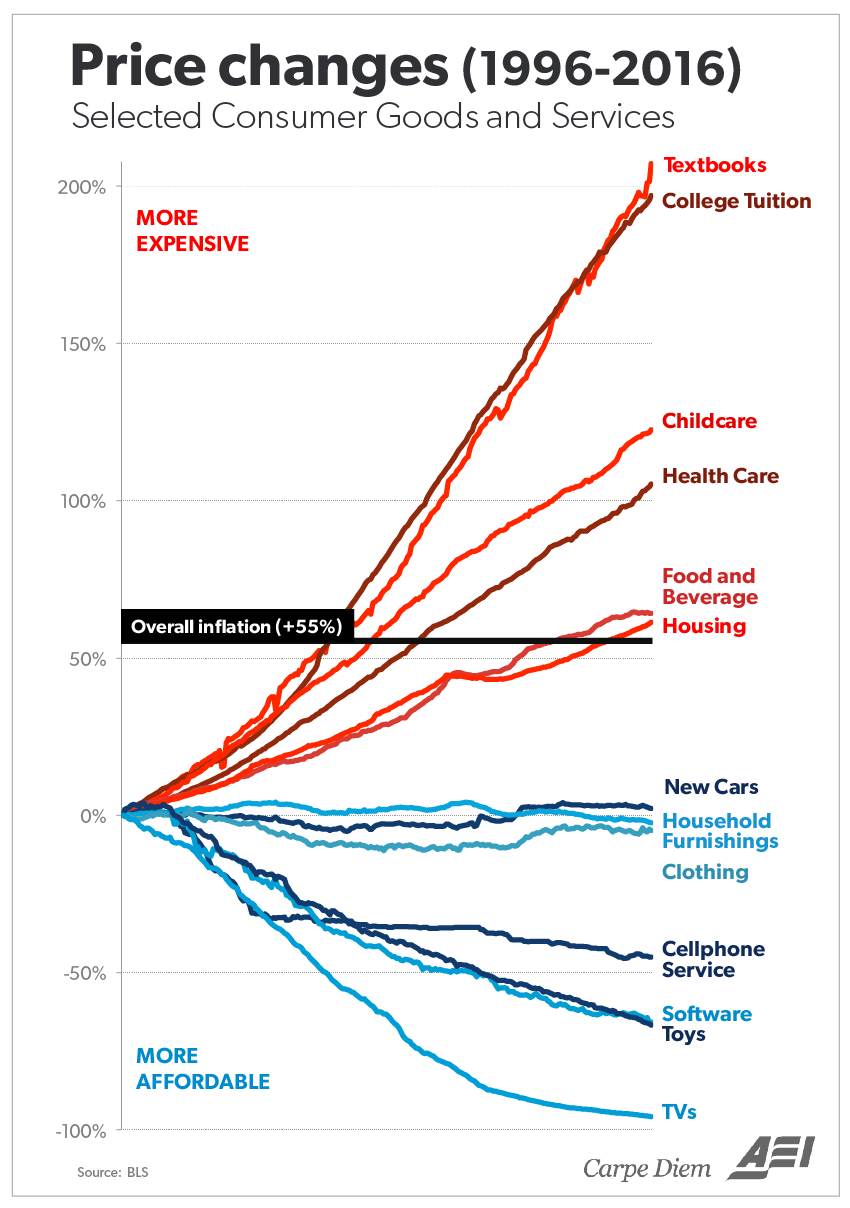
As I work on putting together plans for clients to balance their own retirement and send their kids to a good college, I find myself stepping back wondering how college became so expensive.  Since the mid 1980s, the cost of college has increased 500%! And it continues to grow faster than inflation.  Today’s students are graduating with a mountain of debt.  In fact, there is now more student loan debt than credit card debt.

Just look at this chart to see how out of control college costs have gotten over the last twenty years:

What does this chart say?  Over the last twenty years, items in blue have actually gotten cheaper.  TV’s, software, toys, cars and clothing are all cheaper than they were twenty years ago. The items in red, such as housing, food, health care, childcare and COLLEGE have gotten more expensive over the years.  As much as we complain about the escalating cost of healthcare, it’s not nearly as bad as college.

How did we arrive at this problem?  A simple answer is that money is freely available for people to borrow to pay for college.  The cost does not become a big driver in the decision making process when there are grants, scholarships, tax credits, and even loans involved that mitigate the financial bite.  This results in universities having to offer more services, bigger buildings, better facilities, etc in an effort to attract students who are not as cost conscious as before.

With the government stepping in to provide assistance (loans and tax credits), they are actually contributing to the problem and making it worse.  They are creating a gap between the perceived cost a student pays to go to college and the actual cost to attend.

This happened with real estate when the government wanted everyone to own their own home – loans and incentives fueled the market.  The good intentions of the government backfired as people were given mortgages they couldn’t actually afford, which spurred housing prices to soar… for a while at least.

A similar problem exists in health insurance.  The insured are insulated from the true cost of a service because the health insurance pays for most of the expenses incurred.

If you’re interested in reading more about this and seeing the kinds of solutions that might work, I found this article to be a fascinating read on the subject of college costs.