Sign up with your email address to be the first to know about new products, VIP offers, blog features & more.

All Posts By Michael Lecours, CFP

Social Security Strategies

If you are retiring soon, don’t expect the Social Security Administration (SSA) to give you the best advice on how to start collecting your benefits.  In fact, they have been known to give out poor advice.  I recently heard a story of the SSA sending a letter to a 65 year old, who was not currently collecting social security, which said something to the effect of the following:

“Did you know you could have taken social security at the age of 62? We are offering a lump sum to you for the three years of payments you have missed.”

On the surface it seems great – It sounds like free money. But as you continue to read the letter, you learn that future benefits going forward would be based on if the individual were 62 (about a third less than if the person waited until their full retirement age).

The SSA is doing this to lower their obligations and many individuals will take the SSA up on their offer, only to realize that it was a mistake.

Here are few strategies to help you maximize your social security benefits, but please consult with your financial advisor before you make any decisions.  This is a complicated situation that you should not try to navigate on your own.

1) Instead of looking at maximizing the monthly benefit, look to maximize the total benefit over your lifetime and your spouse’s lifetime. This will help you compare the different options you will develop and determine which one will be best for your situation.

2) To do this you’ll need to approximate how long you and your spouse will live. SSA’s calculator can help link to article. But use your own intuition – if your family has a history of living longer, then factor that into your thinking.

3) Calculate the total benefits using a few different scenarios: Both collect at age 62, both collect at full retirement age (FRA), and both collect at 70, are the easiest to calculate. Hybrid options become more difficult and can best be described as follows: The lower earner collects his or her own reduced benefits at age 62, and unreduced spousal benefits at FRA, while the higher earner collects at age 70. In order for this to work, the higher earner must file and suspend at FRA. There are limitations to this example, so be sure to consult with a financial advisor.

4) With numbers in hand, you can compare the options.  Look at total benefits and the breakout between husband and wife.  You may realize that between two options with similar total benefits, one is better if there is an early death or one lives until 100.  That will be the hardest part as you will see that the longevity assumptions are very important to consider.

It may be wise to enlist the support of a financial advisor who can help in putting together these strategies and determining which one is most appropriate.  We have recently started using a third-party program that illustrates this clearly for our clients.  Email us and we can help run some of the numbers for you.
Tweaking a Buy and Hold Strategy

One of the most common investment strategies is called “Buy and Hold”, which usually consists of mutual funds or other securities held for the long term and rebalanced occasionally.  These funds are held during the best and worst performing years.  The theory is that you can never predict the future performance of the market or time your trades to sell at the top or buy at the bottom. Instead you ride the waves, knowing that there will be ups and downs.

After the recession of 2008 and 2009, the “Buy and Hold” strategy started to lose favor.  Investors could not tolerate such significant declines in their portfolio. It caused many investors to give up on their strategy, sell out of their portfolios at the wrong time (the bottom) and move to cash to wait for better days, more optimism and more clarity.

And so they sat. and sat. and sat.

Here we are, four years later and the S&P 500 has now returned a total of 130% (3/9-12/12). There is a pattern here. American Funds released a newsletter that has a chart on page 2. It highlights the returns for the subsequent 10 years following the major declines of 1939 and 1974. The returns for those two ten year periods were in the 15% range, well above the 11% average for the S&P 500.

It turns out, this sort of return is not unique when compared to historical performance.

For those investors that stayed invested, they are watching their portfolios return to previous levels and grow even more. But, unfortunately many investors are still sitting on the sidelines wondering how to get it.

Maybe “Buy and Hold” is not dead after all!  Although, it may not be right for everyone.

If you are one of the millions of investors who sold out close to the bottom and still reluctant to get back in, consider these strategies:

1 – Limit the amount of news you watch. So much of it is noise and simply a distraction.  Take it with a grain of salt.

2 – Periodically review your statements and make calculated decisions.  It’s easy to react quickly if you see a bad news report and then review your statement.

3 – Keep the course.  Despite all the voices in your head that tell you to sell, hold on to your strategy. It may be hard, but that’s why you have a strategy in the first place.

4 – Stay diversified.  Invest in different asset classes to spread your risk out.  If you are holding too much in one specific stock or mutual fund, consider moving some of it elsewhere.

5 – Consider dollar cost averaging.  If you’re trying to time when to get back in the market or when to make contributions, dollar cost averaging may help.  With most fund companies and broker/dealers, you can establish rules to invest a specific amount each week/month. That may reduce the risk of buying a security only to see it drop shortly after you purchase it. It allows you to ease back into the markets, instead of jumping in.  Keep in mind, this method does not ensure a profit and does not protect against loss in a declining market, so investors should consider their willingness to continue purchases during a declining or fluctuating market.

6 – Get help. It is becoming more and more complicated to invest with more options and increasingly complex products that may not be right for you unless you talk to a professional.

But if you read this, and you feel that even with those changes, you can’t stomach another decline like before then you may need a new strategy all together.  We had several client that express their concern and have developed a model portfolio to meet their needs. It looks to capture profits when trends within a variety of asset classes are positive and sit in cash when the trends are negative.  You can read more about it here.

Finding a Trend in Emerging Market Equities

In reviewing asset class trends for The Active Asset Allocation Portfolio, I saw a divergence of two asset classes – emerging markets and developed markets. I wanted to explore why this is happening.

We find this to be a rather unique situation, as emerging markets tend to be the more volatile cousin of the developed markets. Emerging market highs are higher than developed markets and their lows are lower. But this time is different. Emerging markets had a brief period where their trends were positive compared to the 200-day moving average but struggle to stay above the moving average for a sustained period of time, while the developed markets continue to their positive trend. They’re not moving together, an unusual occurrence. What’s causing the emerging markets to act the way they are is tough to pinpoint, but below are a few obstacles that could be contributing to their sluggish performance.

Obstacles facing emerging markets:

– The United States is re-gaining a competitive advantage by leveraging technology in manufacturing. This is forcing businesses to reevaluate the cost effectiveness of manufacturing in China and other countries that once had a low-cost connotation associated with them. (Source) and (Source)

– The unintended consequences of currency devaluations are effects that can spill over into other countries. In this case, emerging markets are affected by the currency devaluation happening in developed countries, leading to increased wages and possibly increasing inflation. If the Japanese Yen loses value then its exports become cheaper and more attractive than goods from emerging markets. (Source)

– Exports continue to lag as demand remains low. Developed economies have seen growth in health care, industrials, consumer discretionary and consumer staples, none of which are especially strong industries in the emerging markets. (Source)

Advantages for emerging markets:

– The obstacles mentioned above could be be affecting emerging markets on the short term. Many of the sources listed above remain bullish on this asset class for the long term. Maybe this is a buying opportunity?

– If you look at some of the largest emerging market ETFs, you’ll see about 40% of their holdings are in companies located in China, Brazil and Taiwan. Finding a more diversified security or one that minimizes volatility may be an option to consider, such as a low volatility ETF.

Currently, we see no confirmed trend in the Emerging Markets. The BRIC’s, the largest and most commonly thought of Emerging Markets, have not been performing well for reasons mentioned above. But these are not the only emerging markets in the world. There are plenty of others and some of those may be worthy investments either now and in the near future.

Our Take on the “4% Rule” for Retirement Withdrawal

Many advisors tell their clients, as a rule of thumb, a client can withdraw about 4% of their portfolio each year, without it affecting the principal. We have been telling our clients this for years. In fact, this rule of thumb dates back a few decades and was determined after a lot of research.

And then a few weeks ago, an article written in the WSJ called into question the validity of the rule of thumb. Its premise is quite simple: if you retire and then your portfolio drops like it did in 2008, then a withdrawal rate of 4% of the original balance would most likely not be able to sustain you through retirement. You would then need to reduce your withdrawal rate. In the investment and financial community, this was quite a statement to make and has caused many individuals to question their current withdrawal rate.

It’s important to consider a few points that the article touches upon, but are overlooked:

1) The “4% Rule” is a rule of thumb, a guide, a rough figure to help investors determine how much they can withdraw from their portfolio in retirement.

2) A client should only take what they need from their portfolios. They should keep as much invested as possible, so their assets can continue to appreciate. An extra $1,000 sitting in a checking account earning next to nothing, should probably stay in invested where it can generate a decent return.

3) The “4% Rule” does account for some of the long tail risks. When this rule of thumb was calculated in the 90’s, it did use data points going back to the depression. Of course, there are scenarios where the “4% Rule” will not work, but these are the outlier scenarios. They are economic situations that happen every 75 years or so. Fortunately, we are recovering from one of them right now.

The most important point to take away from this post and the article is to remember that the “4% Rule” should be renamed “4% Rule of Thumb”. Maybe then investors will understand that withdrawals will have to fluctuate depending on market conditions and their needs.

If you’re interested in some additional information on this topic, Vanguard has a few interesting pieces on the topic.


Is There Growing Optimism in US Economy?

For the last few weeks, we’ve all been distracted with important issues. To name a few, completing tax returns, listening to the debate on guns, and following the news on the rising tensions in North Korea.

If you think back, you may have missed a headline about the Dow Jones Industrial Average breaking its all-time high. That happened on March 5th, a little less than 2 months ago. It’s a worthy milestone to reach. But what does that mean for your investments or the future?

Everyone has an opinion. When asked “What do you see happening next in the economy”, a well respected economist responded “If I had a crystal ball and knew the answer to that question, I wouldn’t be here. I’d be sitting on the beach.” Some look at this event and say that we’ve reached a high water mark and that we should expect to see the market decline. Others look at this and see it as an indication that the bull market is continuing along. Is the glass half empty or half full? Are you optimistic or pessimistic about the future?

We continue to be optimistic in our approach. We see the looming clouds as bumps and obstacles, but not significant enough to derail the recovery. We see issue after issue being wrestled with and slowly pushed down the road, resulting in near-term clarity, but few long-term solutions

If you’re on the fence, not sure what to make of this recovery, the following link offers a great case for being optimistic about the future.

The Case for Optimism


Recap of a Letter Written Before the Election

The following comment was included in the newsletter we sent to our clients at the end of September. It was written during a period where many were unsure how the election would affect their portfolio.

“It’s actually been a pretty good year for most investors. So here we are about 45 days away from the election, and it appears to me, with the recent surge (both US and global), that the markets are picking up steam.

What explains this improvement, considering the dark clouds apparently forming? Could it be possible that the markets would actually strengthen after the election, regardless of who wins it, simply because one huge uncertainty will have been removed? We’re already at the point where, here in the US, corporate earnings, cash flows, cash positions, and dividend yields are all near record levels.

How did this happen when the investor class is full of dread (a looming fiscal cliff or taxmageddon are being discussed by the talking heads all the time)? Can the gulf of relative value between the US bond market and the US stock market, which has been growing almost unabated for 30 years, grow still wider? Or, could it be that John Templeton is right again, and that it is exactly in times like these that bull markets are born?

I don’t discount the volatility that comes with the cyclic nature of the economy, especially one impacted by globalization. The tough months / quarters / years happen for all sorts of reasons and will probably continue. But there are great companies out there that will continue to sell mass quantities of cola, diapers, and the hottest cell phone, and sell those around the world, even if Greece leaves the Euro, or Spain defaults, or if the wrong person wins the presidential election.”

Trend Updates

The Active Asset Allocation Portfolio utilizes a trend following strategy by buying and selling securities based on established price trends in each asset class, which is determined by comparing the current price with the 200 day simple moving average.  Below is a snapshot of the current trends we are following:


US Equities:

We have been fully invested in this asset class since August. Trends have remained positive.

Foreign Equities:

If we were to slice this asset class into emerging markets and developed markets, we would see two different stories unfold (see other post) or this simple chart from Financial Times.  We are watching some emerging market trends break down and hit the moving average.  These positive trends were not very convincing in the first place and our holdings in this area are limited. Time will tell if the negative trends continue or if they will bounce off the 200-day moving average.  Developed markets have a slightly better story although their trends remain flat to slightly positive. It should be noted, that these comments are generalizations. There are countries that are bucking the trends – we are looking at this asset class on a country by country basis. (Link to Finding a trend in Emerging Market Equities)

Bonds:

The trend continues to remain flat for the most part, which we noted at the end of the 1st quarter.  The only exception are some securities that invest in emerging market debt which have been flat for several months, resulting in the moving average catching up to the current price.  The trend is not conclusive, but it is a sign that it could turn negative.

Real Estate:

One of our longest held positions continues to perform very well.  This asset class has had a few bumps in an otherwise positive trend that has existed for a few years.

Commodities:

Up until last week, many of the trends were flat to slightly negative. Then during last week, the price of gold and silver dropped. This had ramifications throughout the commodity market. Most of the securities we are tracking in this asset class are now below their average. Our positions at the time were minimal given most trends were already negative.

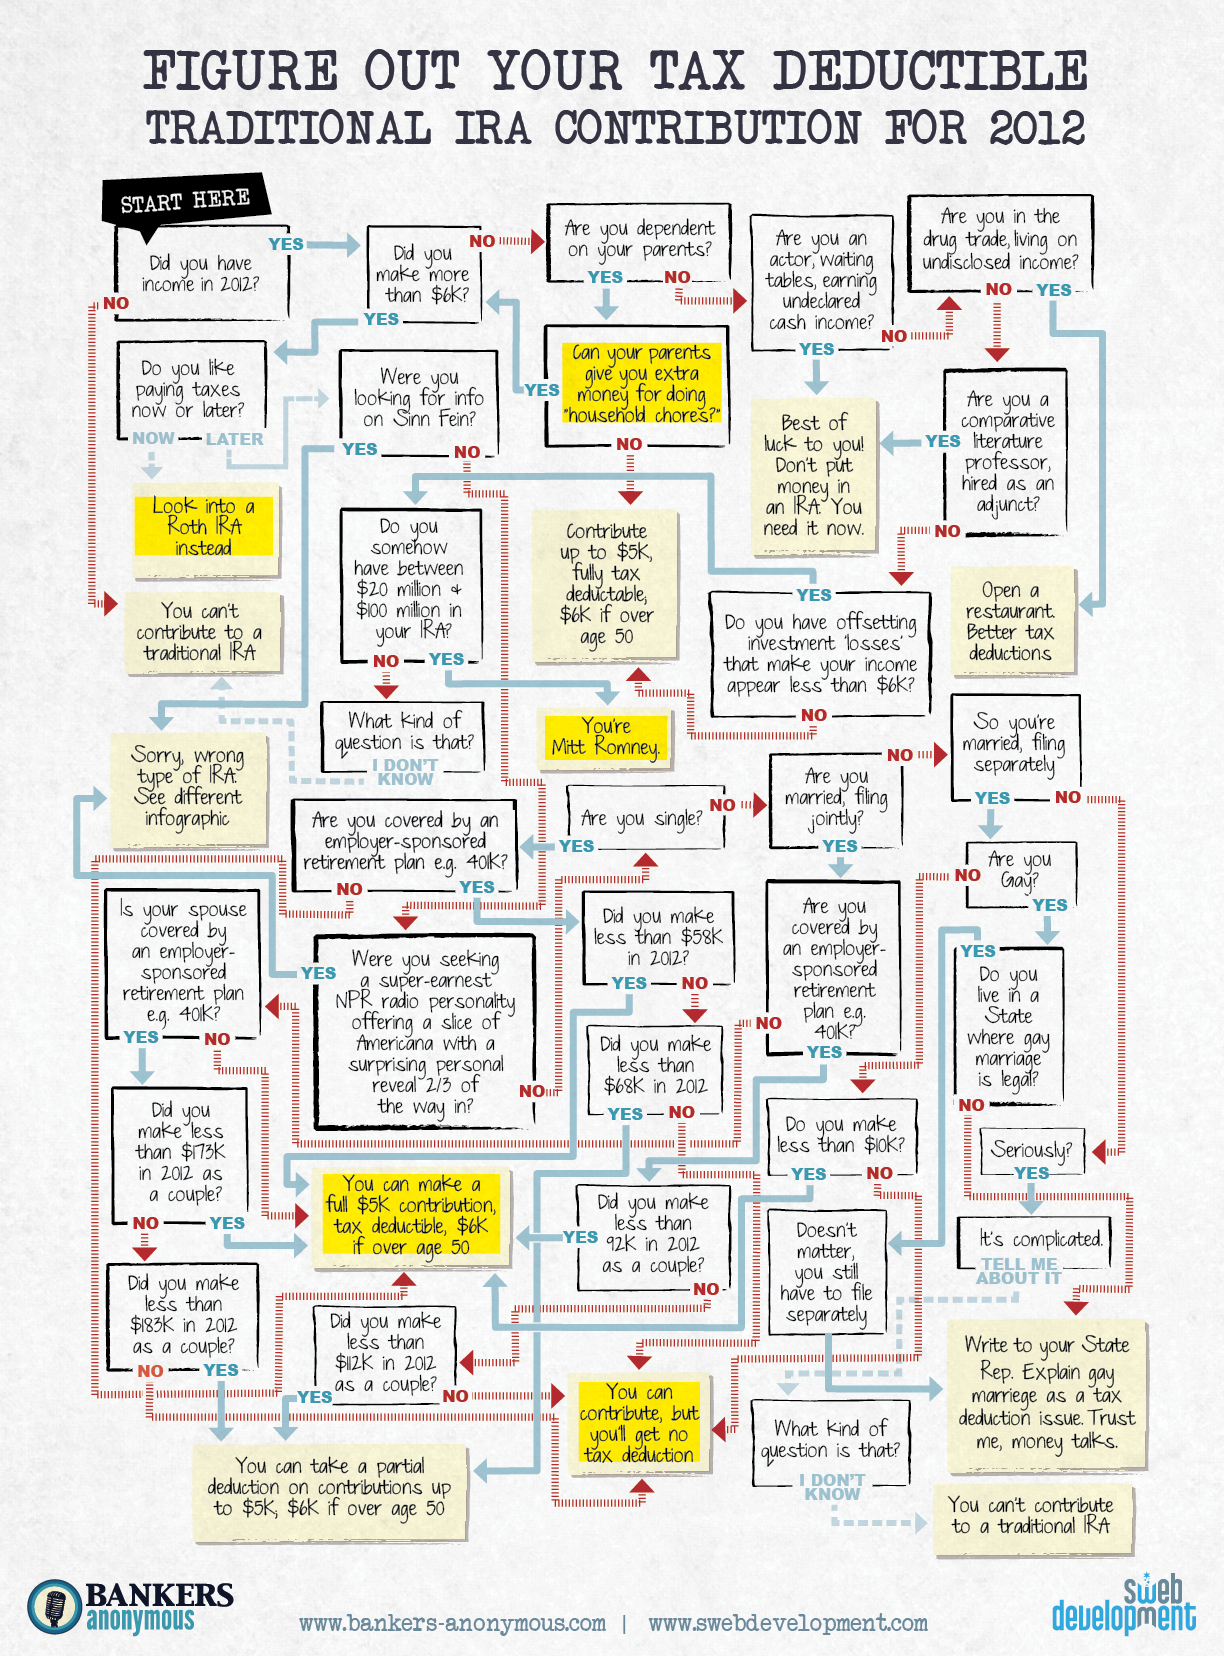
Why Is It So Hard to Make a Tax Deductible Contribution to a Traditional IRA?

During tax season, we had dozens of conversation with clients that begin with the client asking, “can I make a tax deductible contribution to my IRA, so I can lower my tax bill?”

Unfortunately, the answer isn’t a straightforward “yes” or “no”. Rather, we have to drill into each client’s specific situation to make sure we follow the in’s and out’s associated with IRA contributions on a case by case basis. The below infographic does a pretty good job at capturing the complexity of answering the question. Bottom line, before making a contribution to your IRA, consult with a financial advisor or tax professional because it’s complicated.

IRA Contribution Flow Chart

Are You Addicted to News?

A recent article by the Guardian discusses 10 reasons why news can harm you. It’s an interesting read, one that reinforces a message that we regularly communicate to our clients: news is sensationalized to draw viewers but it should be taken with a grain of salt and not relied on to make investment decisions without doing your own research.

The article references the sensational and shocking stories we see. These stories are designed to scare us into doing something (or not doing something). The article fails to recognize, that there is a lot of insightful, objective, and thoroughly-researched journalism produced every single day that readers should be reading. Length does not necessarily indicate quality. Long articles can be sensationalized just as much as a tweet. And a tweet can be more insightful than a long article.

The problem becomes: How to determine quality news from an eye catching headline with regurgitated content. Second, where do we find quality news and who can we trust?

We will cover those questions in a later post.