Sign up with your email address to be the first to know about new products, VIP offers, blog features & more.

All Posts By Michael Lecours, CFP®

Following the Herd

The following post comes from Edward, our summer intern.  He has been helping me prepare for a presentation later this summer on behavioral finance.  What follows are some really interesting comments about how our own behavior can affect our financial decisions… and in some cases it results in a negative outcome. Specifically, his comments deal with a very common behavioral concept called herding.

The human brain is hard wired to agree with the majority of a group in most situations. Whether it’s a multiple-choice question, advice, or even the stock market most people tend to agree with the majority. In 1951, Solomon Asch had created an experiment to test natural conformity. In this experiment he told the subjects they would be taking part in a vision test. A group of participants were gathered in a room, shown an image and asked very simple questions.   They were then shown the image below.

The question asked was “which line on the right matched the line on the left?” Despite the simplicity of the question, 32% of the subjects actually gave the wrong answer.  What the participant’s didn’t know was that everyone else in the room were in on the experiment.  Despite a room full of “participant”, there was actually only one person taking the test.  These “participants” were told to provide a wrong answer.

The actual participant would look around the room and see everyone had come up with a different answer. Then the participant would follow the lead of everyone else and copy their answer. Even though the other lines were off by a few inches, one out of every three would follow along with the crowd. One of the main reasons for their decision was social pressure. Most people wish to be accepted by the group. If they chose differently than the group then they might begin to feel like an outcast.

How does this relate to the market? 

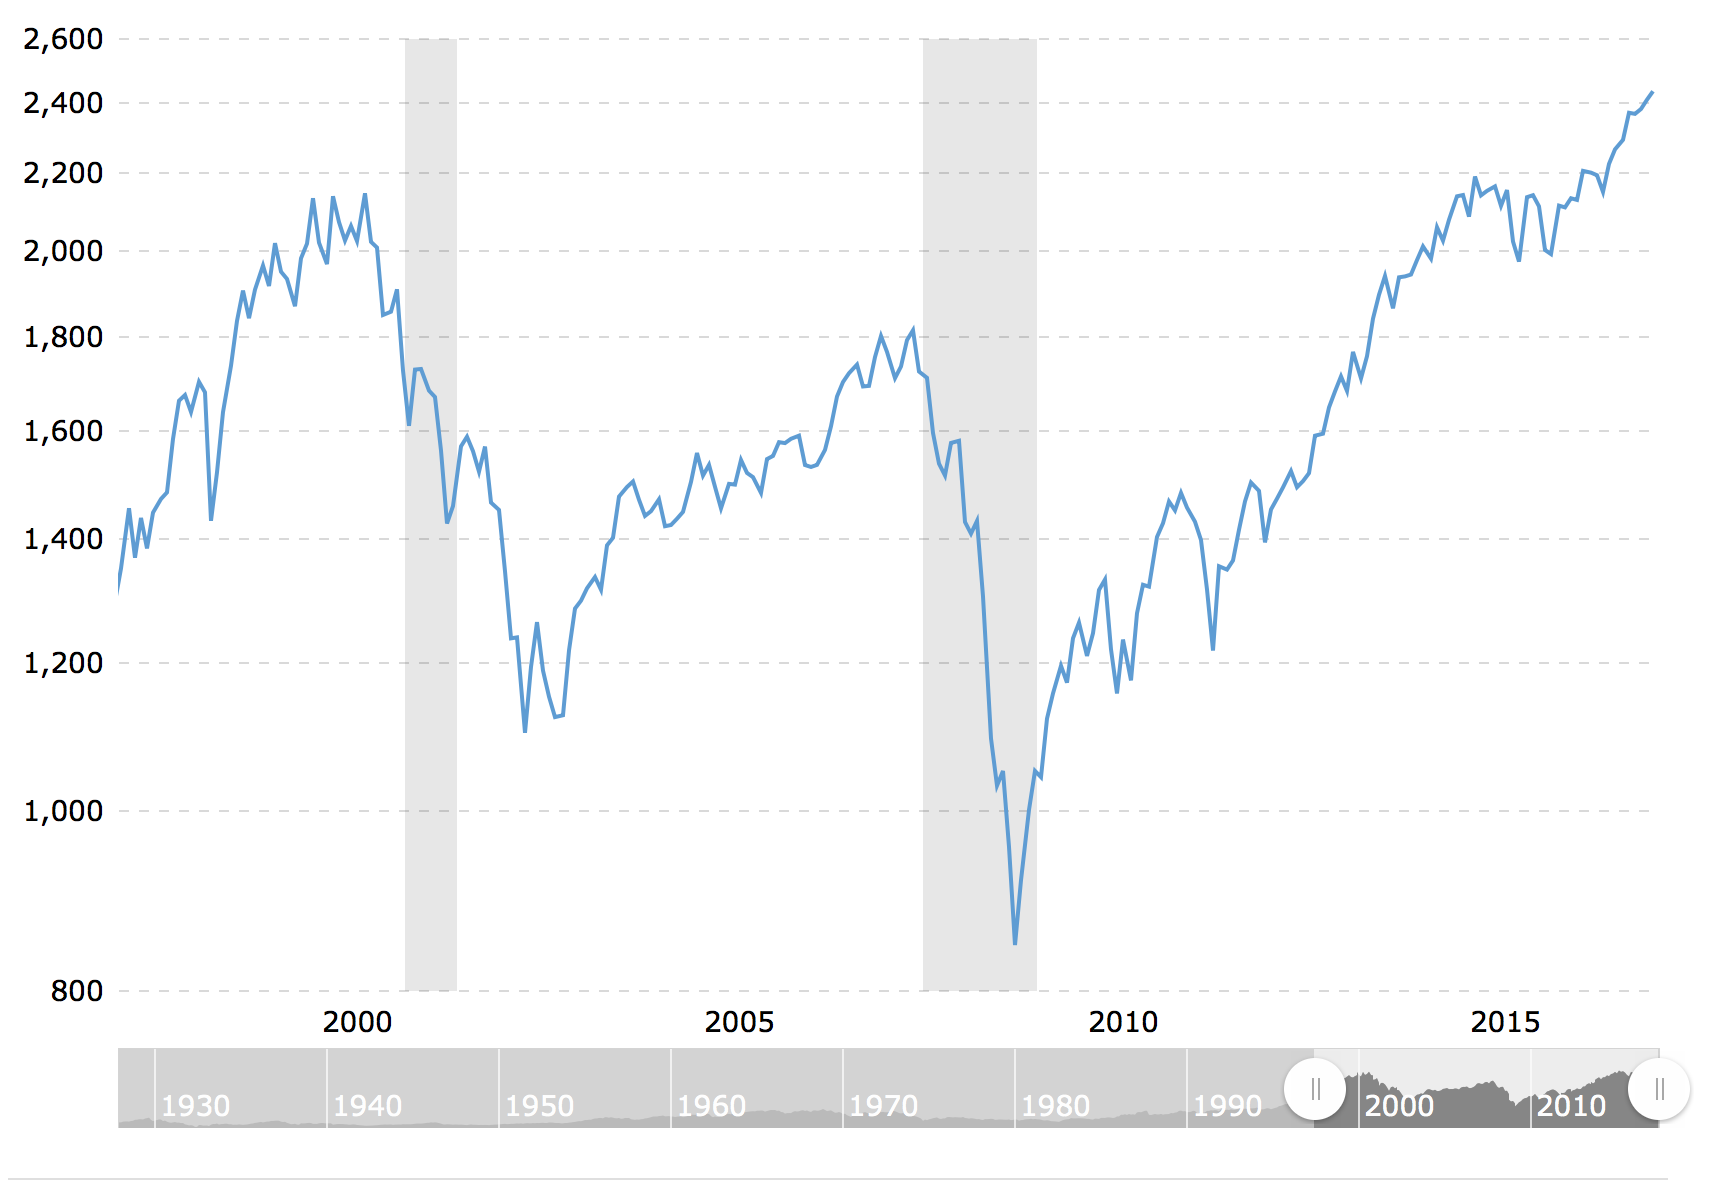
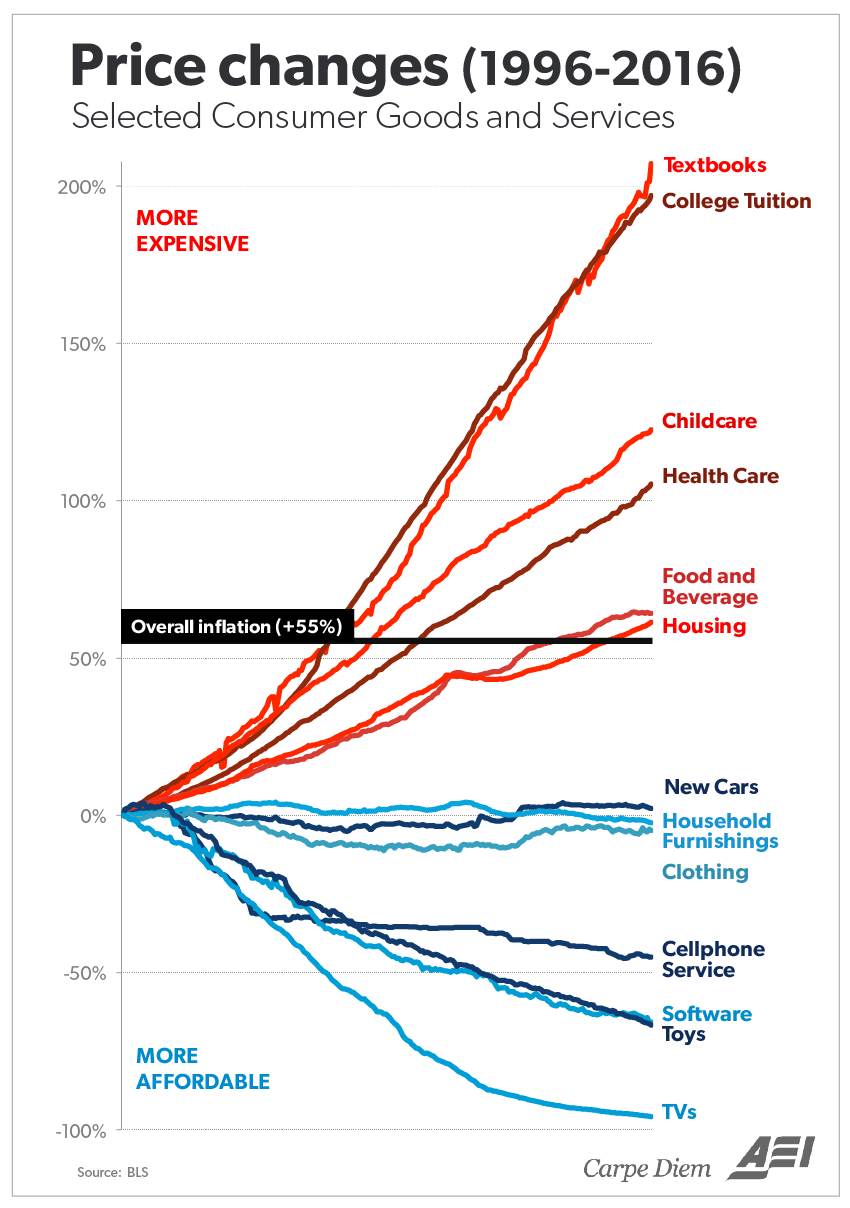
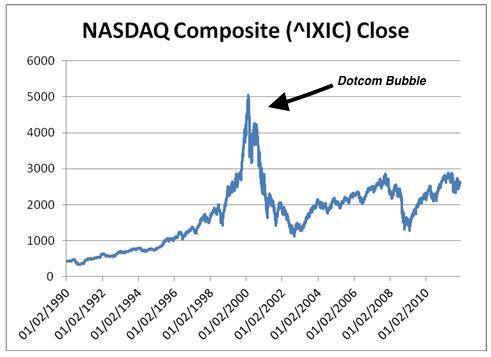
Many people believe that a large group couldn’t possibly be wrong. Even if you are 100% convinced that the group is wrong you might still feel like following the herd is the best option. In the 1990’s many investors were turning toward Internet related companies. However, many of these companies had terrible fundamentals and were not appealing from a technical standpoint. What made people invest in these Internet companies was the fact that so many other people were already investing in them. The average person thought at the time that if thousands of other investors were investing in these Internet related companies then it must be a good move. This investment trend had lead many people to get trapped by the dotcom bubble that had cost them a large chunk of their portfolio.

How to avoid herding:

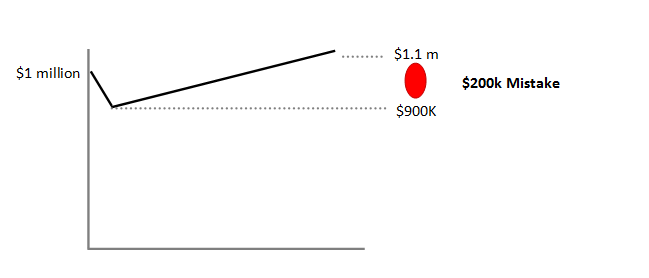
More often than not, jumping into a hot sector or stock because of a popular trend is not a smart move. Just because everyone is hoping on the bandwagon of a new investment, doesn’t necessarily mean it’s going to last.  The questions to ask yourself are “how does this investment contribute to my overall risk profile and asset allocation”  or “what role will this investment play in my portfolio?”

How To Retire Early: A Critique of A Widely Shared Article

Recently, an article has been floating around the internet that presented a simple strategy to retire early.  It seemed too good to be true.  The gist of it is  “Even by simply upping your savings rate from 10% to 20%, you could shave off over 14 years from your retirement timetable.”  But what really caught my eye was the a simple chart that accompanied the quote suggesting the more aggressive you saved, the earlier you could retire:

If interested, you can read the full article here.

I couldn’t find enough details on how these figures were determined.  There was no complete list of assumptions used to arrive at these calculations.  Was Social Security factored into these calculations?  What about inflation? How did they define success?  I decided to do my own analysis and critique the findings on either end of the chart.


Save 10% for 51 Years

For the analysis that follows, I assume a 21 year old saves about $10k a year (10% of a $100k income) and does so for 51 years. And then in retirement, he would live off $100k. Social Security is not factored into this equation.  When we model this scenario, the results are very underwhelming.

The Result:

This scenario is not promising.  There is an extremely high chance that the portfolio would last for only about 12 years in retirement.  When we run through a 1000 market simulations, only 9% of the time will the portfolio last until age 95.

A Modification to Consider:

Let’s add social security to see how this affects the probability. Assuming social security of $30k per year, we can see that probability has jumped from 9% to 74%.  That means that in 74% of the 1000 market simulations, the portfolio lasted at least until age 95.  By leaning on social security to partially fund retirement, the investor doesn’t have to take as much from his savings.

We are getting closer to success, but I would not be comfortable with this plan.  I want to see a confidence level in the 90% range.  To get to a confidence level that I would feel comfortable with, I see three options to consider doing in addition to factoring in social security:

  • Increase savings to $1000/mo
  • Retire three years later
  • Live off $1000/mo less in retirements.

An Even Better Approach:

Let’s go back to our original scenario (without factoring in social security).  Let’s assume that the investor would increase the amount he saved each year by the rate of inflation.  In year one, he saves $10,000, but by year 5 he is saving $10,510.  Now this produces an interesting result:

That small change of saving a little more than the previous year had a profound impact when spread over five decades.  And the best part is that social security is icing on the cake.

Conclusion:

With modifying the assumptions a little bit, this scenario is very realistic.  This closely matches a lot of rules of thumb out there, so I’m not surprised that this scenario is workable.

Save 70% for Nine Years:

Let’s move to the other end of the spectrum and see how we can make the more aggressive goal possible.  Here is a hint: it’s a real stretch.

The obvious issue:  A client earning $100k per year would save $70k in this scenario leaving $30k for taxes and living expenses. That’s simply not enough to live on and pay taxes upon.  Under normal circumstances, I’d stop right there in my analysis. But to make this scenario at least plausible, let’s assume that he works for a company that provides food and that he camps in the parking lot.  You may be laughing, but it does happen. Basically, he has no living expenses and that $30k is used to pay taxes.

Result:

If we take the same client situation as we outlined in the previous example and accelerate retirement to begin in 9 years, the client has absolutely no chance of having the portfolio last through our planned life expectancy of age 95.  I’d be happy if the portfolio lasted for 10 years.


A Modification to Consider:

To make this scenario even remotely possible, the investor would need to slash his retirement income to about $1900 per month if he wants to have a good probability of retiring in 9 years and living off his portfolio until age 95.

Conclusion:

We may find it comical to consider the premise of only working for 9 years and saving the rest, but if this hypothetical person had an extremely modest lifestyle, this modified scenario could be considered.  The author of the chart referenced at the beginning of this post is a proponent of these kinds of retirement strategies and has even retired early himself.  His blog captures his thoughts and strategies and a few months back, I even wrote about this growing extreme retirement trend.


Gambler’s Fallacy: A Behavioral Finance Concept.

We’re having our first intern join us for the summer – Ed Butterly a senior from University of Hartford. While he is assisting me in a lot of research, I have asked him to write for the blog every time he comes across something fascinating.  It was no surprise that he gravitated toward the growing field of behavioral finance.  This new field combines psychology with economics and is causing many experts to rethink economic concepts.  What follows is Ed’s take on one of many different behavioral concepts.


If you’ve ever been to the casino and played roulette you’d understand the concept of gamblers fallacy. Gambler’s fallacy is when an individual believes that a random event is less likely to happen following an event or series of events. For example, if you were playing roulette and the ball landed on a black number 10 times in a row, you might predict that the next spin will land on red. However, this is isn’t an accurate assumption. Prior sequence’s of events does not have an effect on future events. Each spin is independent and has the same probability of landing on either color every time. Relating to this, gamblers fallacy is in the subconscious of the average investor. Many people believe that if a stock or index is increasing for a long period of time its bound to come back down eventually.

The chart above shows the past 20 years of the S&P 500. After looking at the chart, the average investor might not want to invest into a fund that tracks the S&P 500 because it’s never been this high before and they believe it’s bound to come down eventually. According to Gamblers Fallacy, the number of consecutive years of growth shouldn’t attest to future growth down the line.

One solution to overcome our tendency to fall victim to gamblers fallacy is to use a method called Dollar Cost Averaging. In dollar cost averaging you buy the stock or fund at different periods of time no matter what the price is. Here is an example of Dollar cost averaging. In this scenario an investor is buying $1000 worth of WXY stock at the beginning of every month for the next 5 months. Here are the prices at the beginning of every month.


Month 1: $50   = 20 shares

Month 2: $40   = 25 shares

Month 3: $55   = 18 shares

Month 4: $47   = 21 shares

Month 5: $58   = 16 shares


Total shares = 100, Total Cost = $5000

Average Share cost = $50, Total value of shares currently = $5800

Dollar cost averaging may reduce the risk you are taking and may lower the average share cost over time. After five months you have 100 shares of WXY stock and have spent $5000. The 100 shares are worth $5800 meaning you have made $800 in profit just by using dollar cost averaging instead of succumbing to gamblers fallacy.

But it’s important to note: This method does not ensure a profit and does not protect against loss in a declining market, so investors should consider their willingness to continue purchases during a declining or fluctuating market.

24% of Americans Have Absolutely No Emergency Savings. And That’s Good News!

Imagine losing your job or getting hit with an unexpected medical bill.  Chances are you have a some money stashed away to help pay for emergencies.  But 24% of Americans don’t have a single dollar set aside to pay for these emergencies. When an emergency affects them, they have to use credit cards, borrow, or make very difficult decisions about how to pay for emergencies.

But there is a silver lining to this statistic.  This is at the lowest level since 2011, when bankrate.com started doing this poll.  In fact, almost 1 out of 3 Americans have enough cash to cover six months worth of living expenses, which is the highest Bankrate.com has seen.

When looking at a client situation, this is one of the very first areas we review.  We want to make sure that if an emergency were to arise, that our client would have enough cash to cover the expenses that would arise.

If you’re interested in reading more about the recent bankrate.com study, you can read more here.

Top Money Mistakes People Make in Their 30s

I see lists like this all the time and for the most part I cringe at what I read.  The lists over simplify the issues or miss the boat entirely.  But this one is different.  It actually covers most of the items that I see with clients.  With each of the eleven money mistakes, I can think of one client that had made that mistake.

If I were writing this article, I would include a few other top mistakes.  For starters, I would include mistakes around homeownership and when is the right time to buy a bigger house.  That’s a common question or issue I run across.  I’d also suggest that people in their 30’s have an emergency fund set aside in cash.  Finally, I’d strongly encourage people in their 30’s to eliminate any credit card debt.

How to Plan When You Don’t Know Your Goals

Defining one’s goals isn’t easy for some people. Trying to envision what your life will look like at some point in the future can be difficult.  There are so many emotional and financial variables and so many unknowns in life that it can leave you feeling stuck or in a holding pattern until you find clarity.  We know that because it is a relatively common issue that we run into with our clients and an issue we try to help resolve for them. Retirements, illness, or the death of a family member can be very disruptive.

We help clients find clarity by trying to quantify the financial impacts of their situation and model other scenarios they are considering.

To illustrate what we do, let’s consider a typical client situation.  A couple with two college-age children have come to us looking for guidance in planning for their future.  They have very good incomes and a vacation property, but there expenses are high and they have not saved as much as they should have in the past.

Here is our process to help get this client out of their holding pattern:

  1.  We model their current financial situation and extrapolate those results out through their retirement.  Every conceivable financial variable is used to model the current situation: income expenses, accounts, assets, social security, etc.  The result is some perspective on the likelihood of maintaining the current lifestyle assuming nothing changes.  The model is summarized in a simple graphic, an example of which is below.
  2. The graphic above is presented to the client. The big circled number at the top provides a probability of success for the client to reach their financial goals.  The calculation uses Monte Carlo Simulations to imagine sequence of returns risk.  Basically, the model runs 1000 simulations to imagine how rates of returns affect a client reaching his goals.  What happens if there is a big recession early in retirement?  What happens if there is a big recession later in retirement?  What happens if the markets are flat for several years?  These are all scenarios that are modeled and considered and shows that of the 1000 simulations, 77%  result in their goals being met:
  3. In the first example above, it shows that their annual savings of $27,500 is used to successfully fund college education for two children as evident by the two green bars.  But it comes at an expense -their retirement is not fully funded as seen by the yellow bar.  This is where the conversation begins.
  4. We can begin to model changes on the fly to see how certain changes will affect their future in retirement.  In this example, the client has been wondering if they should sell their vacation property and use the savings for retirement.  We can quickly quantify the long term impact of that decision:
  5. Then we can see how that change will affect the probability of success.  We can see below that by making this one change, we have increased the probability of success from 77% to 93%.
  6. Sometimes, this gives the client enough clarity to make a decision and move on.  But that’s not always the case.  After the client has thought about making a major decision (such as selling a vacation home), they may come back saying they can not actually sell their vacation property and need to consider other options.  Below is a comparison of their current situation compared to a scenario in which they delay retirement for two more years.  The result is almost the same as if they sold the vacation property.

After this exercise, the client has two viable options to consider to get them on track for retirement.  By seeing certain scenarios modeled, it can make possible decision more real to them and hopefully more achievable.  The illustration we provide help them make better decisions.

There are lots of emotional decisions that revolve around major life decisions, like retiring, changing jobs/careers, and moving.  We believe that by addressing the financial impacts of these decisions, we can affect the emotional considerations that may be holding our clients back.  Our goal is to provide that nudge to get them moving in the right direction and to keep them from making mistakes.

If you feel like you are stuck or need help laying a clear path forward, please reach out to us:


Effects of Saving an Extra $20 Each Week

Saving just a little bit extra each year can have a profound impact over the long term.  Investor’s Business Daily ran some pretty interesting numbers showing the impact on one’s retirement if an extra $20 is saved every week.  Here is some of the findings based on certain age ranges:

Recent College Grad: invest $20/wk earning 6% and by retirement, that pot of money will be about $330,000.

Someone in their mid-40s:  invest $20/wk earning 6% and by retirement, that pot of money will be about $40,000.

Someone in their mid-50s:  invest $20/wk earning 6% and by retirement, that pot of money will be about $14,000.

The results are pretty clear – consistently investing over many decades can have exponential benefits on your financial situation.  Even small amounts can add up to have a big impact when time is on your side.


What Drives the Cost of College

With all of our clients who have children, planning for college expenses is the one of the biggest concerns that keeps them up at night.  Retirement planning may be a bigger issue in the long term, but the children will be going to college a lot sooner than their parents will retire.

As I work on putting together plans for clients to balance their own retirement and send their kids to a good college, I find myself stepping back wondering how college became so expensive.  Since the mid 1980s, the cost of college has increased 500%! And it continues to grow faster than inflation.  Today’s students are graduating with a mountain of debt.  In fact, there is now more student loan debt than credit card debt.

Just look at this chart to see how out of control college costs have gotten over the last twenty years:

What does this chart say?  Over the last twenty years, items in blue have actually gotten cheaper.  TV’s, software, toys, cars and clothing are all cheaper than they were twenty years ago. The items in red, such as housing, food, health care, childcare and COLLEGE have gotten more expensive over the years.  As much as we complain about the escalating cost of healthcare, it’s not nearly as bad as college.

How did we arrive at this problem?  A simple answer is that money is freely available for people to borrow to pay for college.  The cost does not become a big driver in the decision making process when there are grants, scholarships, tax credits, and even loans involved that mitigate the financial bite.  This results in universities having to offer more services, bigger buildings, better facilities, etc in an effort to attract students who are not as cost conscious as before.

With the government stepping in to provide assistance (loans and tax credits), they are actually contributing to the problem and making it worse.  They are creating a gap between the perceived cost a student pays to go to college and the actual cost to attend.

This happened with real estate when the government wanted everyone to own their own home – loans and incentives fueled the market.  The good intentions of the government backfired as people were given mortgages they couldn’t actually afford, which spurred housing prices to soar… for a while at least.

A similar problem exists in health insurance.  The insured are insulated from the true cost of a service because the health insurance pays for most of the expenses incurred.

If you’re interested in reading more about this and seeing the kinds of solutions that might work, I found this article to be a fascinating read on the subject of college costs.


A $200,000 Mistake

In early 2016, the stock market experienced a 10% market correction in a matter of a few weeks.  It resulted in a few phone calls from clients wondering if they should move to cash.  One conversation with a recent retiree really stood out for me and I wanted to share an abbreviated version of it with my readers:

Client:  At the start of the year, I had $1 million invested in the market.  But now it’s February and I’ve lost $100k. We’ve got to stop these losses.  Please sell me out of everything and put me into cash.

Me: Would you consider staying the course a while longer?  As quickly as the market can decline, it can increase just as fast.

Client: Thank you, but I still want to move to cash.

Me: How about we sell 10% of the total value of the account?  That will cover your distributions for the next two to three years.

Client:  No thank you.  I want to be in cash now.

Me: Just one last idea – how about we move 50% of the account into cash?  That will cover your distributions for 10 years.  And in ten years, you can tap into your investments for your future distributions.

Client:  Look, I rode out the 2008 and 2009 recession and I don’t want to have to do it again.  I’d rather keep it in the bank and not have to worry about the stock market.

Me:  Ok, I’ll sell everything today.


There is a lot to process in this conversation.  First, the client called up believing they lost money.  Between the start of the year and the day the client called, the account had declined about 10%.  The sketch below shows how he visualized the loss.

From a behavioral finance perspective, the client anchored his thinking to the high point in their portfolio.  It became his frame of reference, his point of comparison. But if we looked backward and used a different reference point the story changes.  We would see that his account balance is right where it was 12 months earlier:

The idea of anchoring to a high point is a common issue that behavioral economists study.  We, as humans, sometimes make irrational decisions.  We make decisions that we believe to be based on objective facts, but are in reality detriments in how we try to solve problems.  I tried to reframe this particular client’s thinking a few different times but was unsuccessful.

Recently, I went back and reviewed this client’s portfolio to see how he would have done if he stayed the course.  As we know, the market ended up recovering and ended the year up about 10%!

The day the client called wanting to sell out of the market ended up being the very bottom of the market “correction”. For the rest of the year, the stock market recovered from its lows in February and then began to reach new highs by the end of the year.  Unfortunately, that client stayed in cash for the rest of the year.  It has resulted in a $200,000 mistake!

That red circle in the sketch above represents a behavior gap.  This is a well documented phenomenon in which investor decisions and behaviors are dragging down their portfolio performance (Morningstar). In this case, it could have been completely avoided or at least significantly minimized.  The quick reaction to move to cash will have a lasting impact on this client, but he probably won’t notice it until his cash balance is drawn down substantially.

This serves as an example for investors to stick to their plan and avoid making sudden and drastic changes to their investment strategy… and to listen to alternative suggestions from their advisor.