Recently, an article has been floating around the internet that presented a simple strategy to retire early. It seemed too good to be true. The gist of it is “Even by simply upping your savings rate from 10% to 20%, you could shave off over 14 years from your retirement timetable.” But what really caught my eye was the a simple chart that accompanied the quote suggesting the more aggressive you saved, the earlier you could retire:
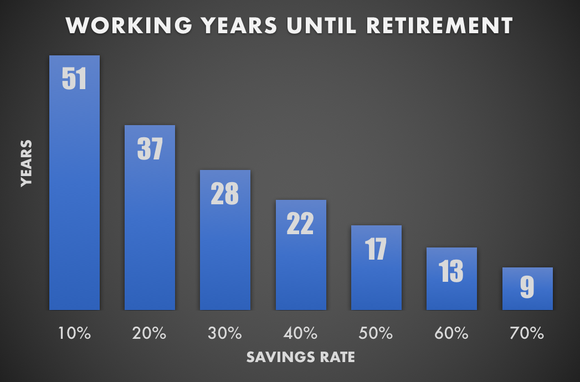
If interested, you can read the full article here.
I couldn’t find enough details on how these figures were determined. There was no complete list of assumptions used to arrive at these calculations. Was Social Security factored into these calculations? What about inflation? How did they define success? I decided to do my own analysis and critique the findings on either end of the chart.
Save 10% for 51 Years
For the analysis that follows, I assume a 21 year old saves about $10k a year (10% of a $100k income) and does so for 51 years. And then in retirement, he would live off $100k. Social Security is not factored into this equation. When we model this scenario, the results are very underwhelming.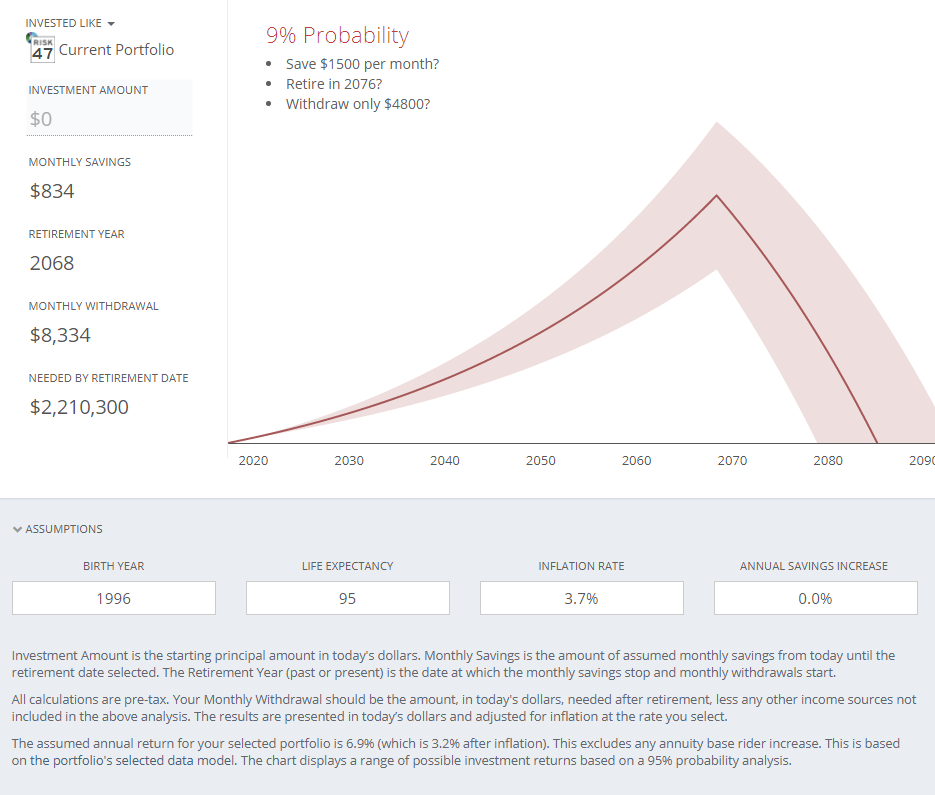
The Result:
This scenario is not promising. There is an extremely high chance that the portfolio would last for only about 12 years in retirement. When we run through a 1000 market simulations, only 9% of the time will the portfolio last until age 95.
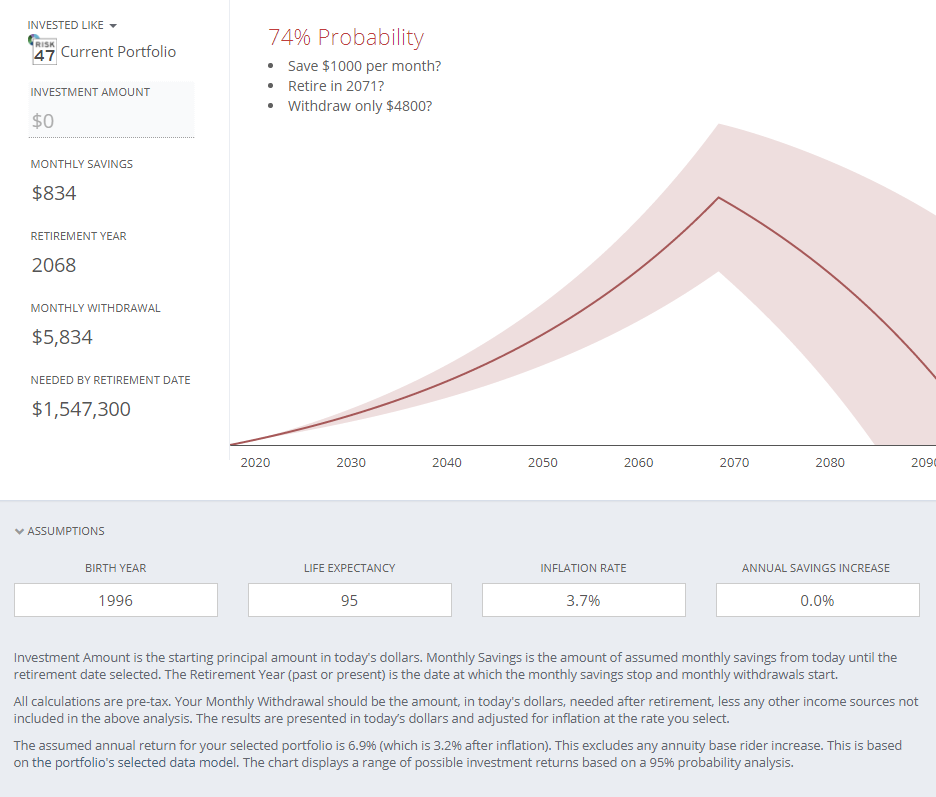
A Modification to Consider:
Let’s add social security to see how this affects the probability. Assuming social security of $30k per year, we can see that probability has jumped from 9% to 74%. That means that in 74% of the 1000 market simulations, the portfolio lasted at least until age 95. By leaning on social security to partially fund retirement, the investor doesn’t have to take as much from his savings.
We are getting closer to success, but I would not be comfortable with this plan. I want to see a confidence level in the 90% range. To get to a confidence level that I would feel comfortable with, I see three options to consider doing in addition to factoring in social security:
- Increase savings to $1000/mo
- Retire three years later
- Live off $1000/mo less in retirements.
An Even Better Approach:
Let’s go back to our original scenario (without factoring in social security). Let’s assume that the investor would increase the amount he saved each year by the rate of inflation. In year one, he saves $10,000, but by year 5 he is saving $10,510. Now this produces an interesting result:
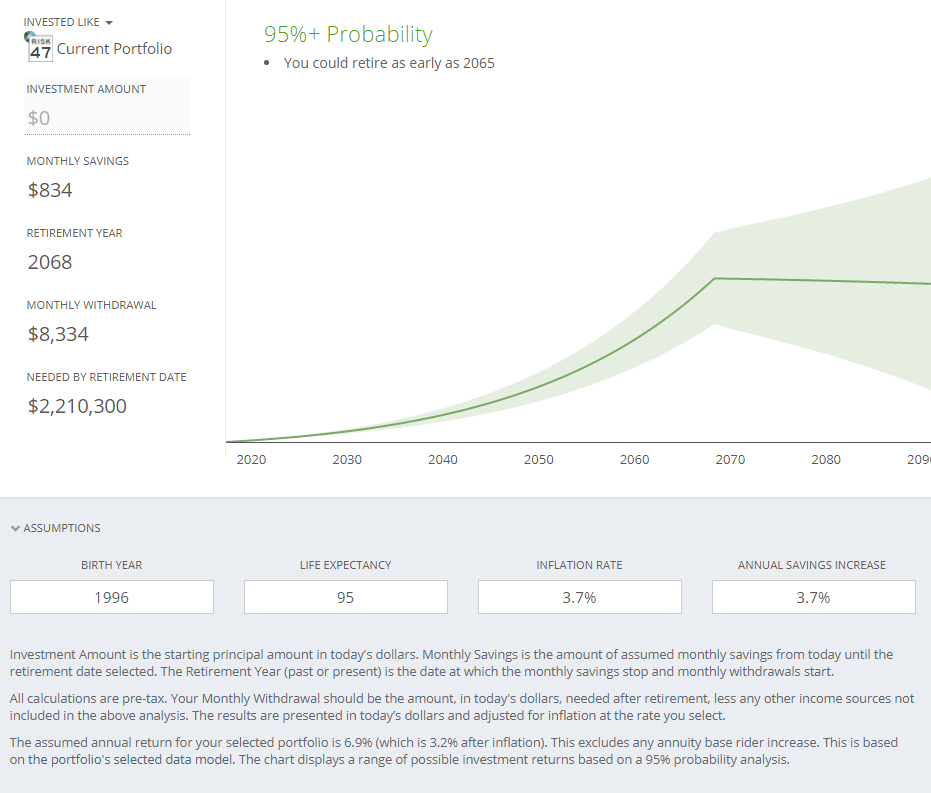
That small change of saving a little more than the previous year had a profound impact when spread over five decades. And the best part is that social security is icing on the cake.
Conclusion:
With modifying the assumptions a little bit, this scenario is very realistic. This closely matches a lot of rules of thumb out there, so I’m not surprised that this scenario is workable.
Save 70% for Nine Years:
Let’s move to the other end of the spectrum and see how we can make the more aggressive goal possible. Here is a hint: it’s a real stretch.
The obvious issue: A client earning $100k per year would save $70k in this scenario leaving $30k for taxes and living expenses. That’s simply not enough to live on and pay taxes upon. Under normal circumstances, I’d stop right there in my analysis. But to make this scenario at least plausible, let’s assume that he works for a company that provides food and that he camps in the parking lot. You may be laughing, but it does happen. Basically, he has no living expenses and that $30k is used to pay taxes.
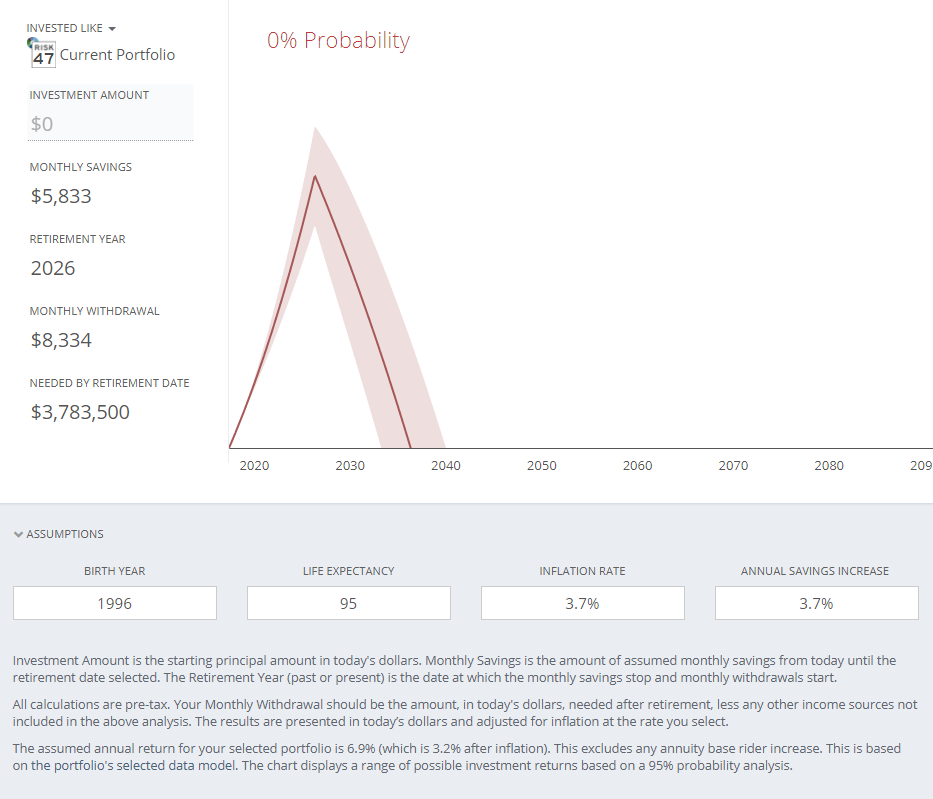
Result:
If we take the same client situation as we outlined in the previous example and accelerate retirement to begin in 9 years, the client has absolutely no chance of having the portfolio last through our planned life expectancy of age 95. I’d be happy if the portfolio lasted for 10 years.
A Modification to Consider:
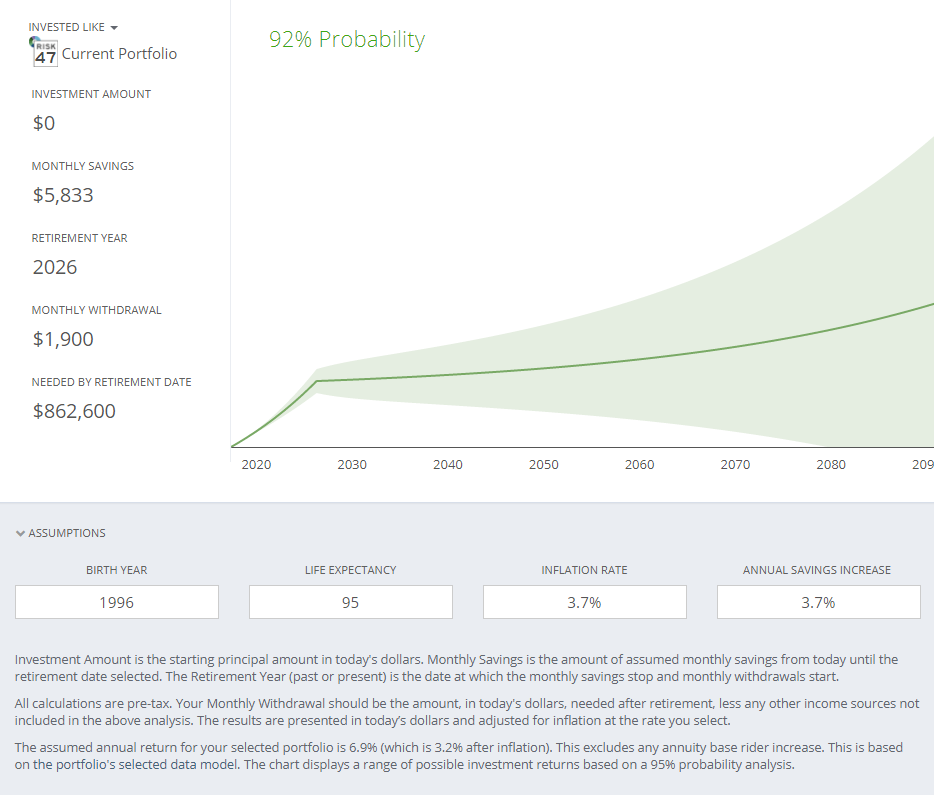
To make this scenario even remotely possible, the investor would need to slash his retirement income to about $1900 per month if he wants to have a good probability of retiring in 9 years and living off his portfolio until age 95.
Conclusion:
We may find it comical to consider the premise of only working for 9 years and saving the rest, but if this hypothetical person had an extremely modest lifestyle, this modified scenario could be considered. The author of the chart referenced at the beginning of this post is a proponent of these kinds of retirement strategies and has even retired early himself. His blog captures his thoughts and strategies and a few months back, I even wrote about this growing extreme retirement trend.