Sign up with your email address to be the first to know about new products, VIP offers, blog features & more.

24% of Americans Have Absolutely No Emergency Savings. And That’s Good News!

Imagine losing your job or getting hit with an unexpected medical bill.  Chances are you have a some money stashed away to help pay for emergencies.  But 24% of Americans don’t have a single dollar set aside to pay for these emergencies. When an emergency affects them, they have to use credit cards, borrow, or make very difficult decisions about how to pay for emergencies.

But there is a silver lining to this statistic.  This is at the lowest level since 2011, when bankrate.com started doing this poll.  In fact, almost 1 out of 3 Americans have enough cash to cover six months worth of living expenses, which is the highest Bankrate.com has seen.

When looking at a client situation, this is one of the very first areas we review.  We want to make sure that if an emergency were to arise, that our client would have enough cash to cover the expenses that would arise.

If you’re interested in reading more about the recent bankrate.com study, you can read more here.

Top Money Mistakes People Make in Their 30s

I see lists like this all the time and for the most part I cringe at what I read.  The lists over simplify the issues or miss the boat entirely.  But this one is different.  It actually covers most of the items that I see with clients.  With each of the eleven money mistakes, I can think of one client that had made that mistake.

If I were writing this article, I would include a few other top mistakes.  For starters, I would include mistakes around homeownership and when is the right time to buy a bigger house.  That’s a common question or issue I run across.  I’d also suggest that people in their 30’s have an emergency fund set aside in cash.  Finally, I’d strongly encourage people in their 30’s to eliminate any credit card debt.

How to Plan When You Don’t Know Your Goals

Defining one’s goals isn’t easy for some people. Trying to envision what your life will look like at some point in the future can be difficult.  There are so many emotional and financial variables and so many unknowns in life that it can leave you feeling stuck or in a holding pattern until you find clarity.  We know that because it is a relatively common issue that we run into with our clients and an issue we try to help resolve for them. Retirements, illness, or the death of a family member can be very disruptive.

We help clients find clarity by trying to quantify the financial impacts of their situation and model other scenarios they are considering.

To illustrate what we do, let’s consider a typical client situation.  A couple with two college-age children have come to us looking for guidance in planning for their future.  They have very good incomes and a vacation property, but there expenses are high and they have not saved as much as they should have in the past.

Here is our process to help get this client out of their holding pattern:

  1.  We model their current financial situation and extrapolate those results out through their retirement.  Every conceivable financial variable is used to model the current situation: income expenses, accounts, assets, social security, etc.  The result is some perspective on the likelihood of maintaining the current lifestyle assuming nothing changes.  The model is summarized in a simple graphic, an example of which is below.
  2. The graphic above is presented to the client. The big circled number at the top provides a probability of success for the client to reach their financial goals.  The calculation uses Monte Carlo Simulations to imagine sequence of returns risk.  Basically, the model runs 1000 simulations to imagine how rates of returns affect a client reaching his goals.  What happens if there is a big recession early in retirement?  What happens if there is a big recession later in retirement?  What happens if the markets are flat for several years?  These are all scenarios that are modeled and considered and shows that of the 1000 simulations, 77%  result in their goals being met:
  3. In the first example above, it shows that their annual savings of $27,500 is used to successfully fund college education for two children as evident by the two green bars.  But it comes at an expense -their retirement is not fully funded as seen by the yellow bar.  This is where the conversation begins.
  4. We can begin to model changes on the fly to see how certain changes will affect their future in retirement.  In this example, the client has been wondering if they should sell their vacation property and use the savings for retirement.  We can quickly quantify the long term impact of that decision:
  5. Then we can see how that change will affect the probability of success.  We can see below that by making this one change, we have increased the probability of success from 77% to 93%.
  6. Sometimes, this gives the client enough clarity to make a decision and move on.  But that’s not always the case.  After the client has thought about making a major decision (such as selling a vacation home), they may come back saying they can not actually sell their vacation property and need to consider other options.  Below is a comparison of their current situation compared to a scenario in which they delay retirement for two more years.  The result is almost the same as if they sold the vacation property.

After this exercise, the client has two viable options to consider to get them on track for retirement.  By seeing certain scenarios modeled, it can make possible decision more real to them and hopefully more achievable.  The illustration we provide help them make better decisions.

There are lots of emotional decisions that revolve around major life decisions, like retiring, changing jobs/careers, and moving.  We believe that by addressing the financial impacts of these decisions, we can affect the emotional considerations that may be holding our clients back.  Our goal is to provide that nudge to get them moving in the right direction and to keep them from making mistakes.

If you feel like you are stuck or need help laying a clear path forward, please reach out to us:


Effects of Saving an Extra $20 Each Week

Saving just a little bit extra each year can have a profound impact over the long term.  Investor’s Business Daily ran some pretty interesting numbers showing the impact on one’s retirement if an extra $20 is saved every week.  Here is some of the findings based on certain age ranges:

Recent College Grad: invest $20/wk earning 6% and by retirement, that pot of money will be about $330,000.

Someone in their mid-40s:  invest $20/wk earning 6% and by retirement, that pot of money will be about $40,000.

Someone in their mid-50s:  invest $20/wk earning 6% and by retirement, that pot of money will be about $14,000.

The results are pretty clear – consistently investing over many decades can have exponential benefits on your financial situation.  Even small amounts can add up to have a big impact when time is on your side.


What Drives the Cost of College

With all of our clients who have children, planning for college expenses is the one of the biggest concerns that keeps them up at night.  Retirement planning may be a bigger issue in the long term, but the children will be going to college a lot sooner than their parents will retire.

As I work on putting together plans for clients to balance their own retirement and send their kids to a good college, I find myself stepping back wondering how college became so expensive.  Since the mid 1980s, the cost of college has increased 500%! And it continues to grow faster than inflation.  Today’s students are graduating with a mountain of debt.  In fact, there is now more student loan debt than credit card debt.

Just look at this chart to see how out of control college costs have gotten over the last twenty years:

What does this chart say?  Over the last twenty years, items in blue have actually gotten cheaper.  TV’s, software, toys, cars and clothing are all cheaper than they were twenty years ago. The items in red, such as housing, food, health care, childcare and COLLEGE have gotten more expensive over the years.  As much as we complain about the escalating cost of healthcare, it’s not nearly as bad as college.

How did we arrive at this problem?  A simple answer is that money is freely available for people to borrow to pay for college.  The cost does not become a big driver in the decision making process when there are grants, scholarships, tax credits, and even loans involved that mitigate the financial bite.  This results in universities having to offer more services, bigger buildings, better facilities, etc in an effort to attract students who are not as cost conscious as before.

With the government stepping in to provide assistance (loans and tax credits), they are actually contributing to the problem and making it worse.  They are creating a gap between the perceived cost a student pays to go to college and the actual cost to attend.

This happened with real estate when the government wanted everyone to own their own home – loans and incentives fueled the market.  The good intentions of the government backfired as people were given mortgages they couldn’t actually afford, which spurred housing prices to soar… for a while at least.

A similar problem exists in health insurance.  The insured are insulated from the true cost of a service because the health insurance pays for most of the expenses incurred.

If you’re interested in reading more about this and seeing the kinds of solutions that might work, I found this article to be a fascinating read on the subject of college costs.


A $200,000 Mistake

In early 2016, the stock market experienced a 10% market correction in a matter of a few weeks.  It resulted in a few phone calls from clients wondering if they should move to cash.  One conversation with a recent retiree really stood out for me and I wanted to share an abbreviated version of it with my readers:

Client:  At the start of the year, I had $1 million invested in the market.  But now it’s February and I’ve lost $100k. We’ve got to stop these losses.  Please sell me out of everything and put me into cash.

Me: Would you consider staying the course a while longer?  As quickly as the market can decline, it can increase just as fast.

Client: Thank you, but I still want to move to cash.

Me: How about we sell 10% of the total value of the account?  That will cover your distributions for the next two to three years.

Client:  No thank you.  I want to be in cash now.

Me: Just one last idea – how about we move 50% of the account into cash?  That will cover your distributions for 10 years.  And in ten years, you can tap into your investments for your future distributions.

Client:  Look, I rode out the 2008 and 2009 recession and I don’t want to have to do it again.  I’d rather keep it in the bank and not have to worry about the stock market.

Me:  Ok, I’ll sell everything today.


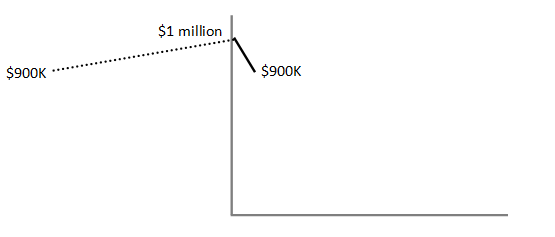
There is a lot to process in this conversation.  First, the client called up believing they lost money.  Between the start of the year and the day the client called, the account had declined about 10%.  The sketch below shows how he visualized the loss.

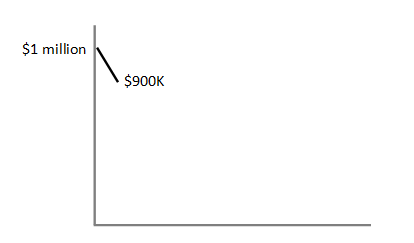
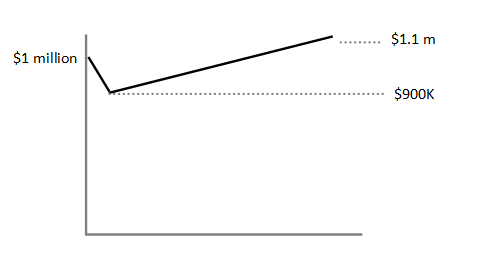
From a behavioral finance perspective, the client anchored his thinking to the high point in their portfolio.  It became his frame of reference, his point of comparison. But if we looked backward and used a different reference point the story changes.  We would see that his account balance is right where it was 12 months earlier:

The idea of anchoring to a high point is a common issue that behavioral economists study.  We, as humans, sometimes make irrational decisions.  We make decisions that we believe to be based on objective facts, but are in reality detriments in how we try to solve problems.  I tried to reframe this particular client’s thinking a few different times but was unsuccessful.

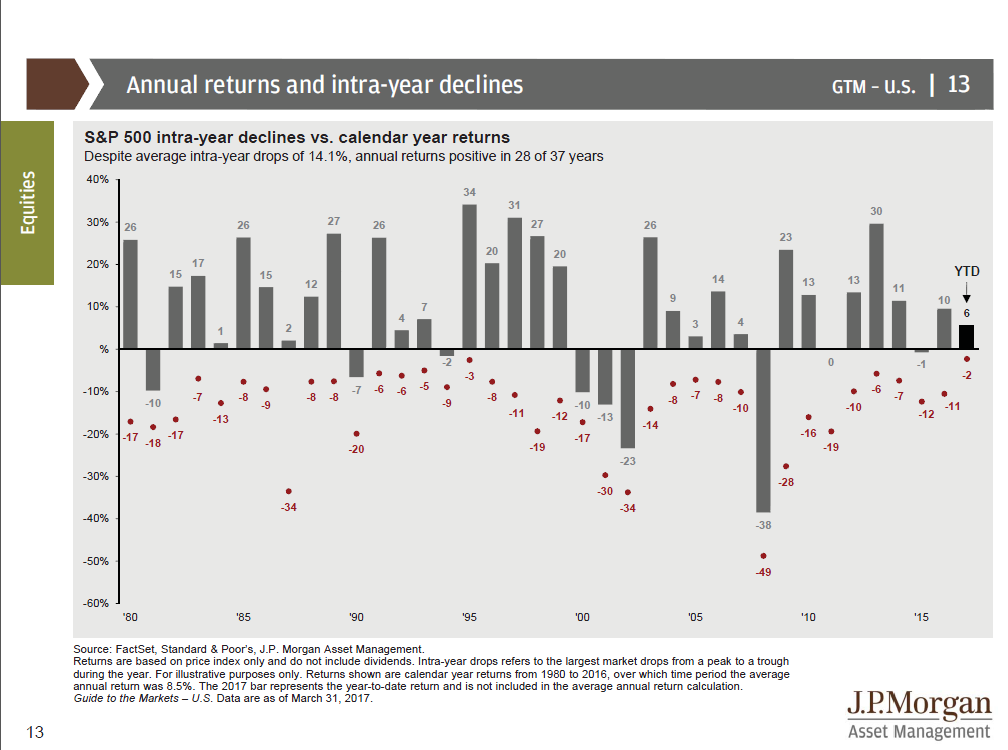
Recently, I went back and reviewed this client’s portfolio to see how he would have done if he stayed the course.  As we know, the market ended up recovering and ended the year up about 10%!

The day the client called wanting to sell out of the market ended up being the very bottom of the market “correction”. For the rest of the year, the stock market recovered from its lows in February and then began to reach new highs by the end of the year.  Unfortunately, that client stayed in cash for the rest of the year.  It has resulted in a $200,000 mistake!

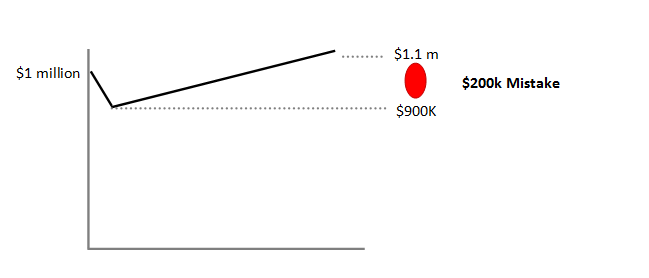
That red circle in the sketch above represents a behavior gap.  This is a well documented phenomenon in which investor decisions and behaviors are dragging down their portfolio performance (Morningstar). In this case, it could have been completely avoided or at least significantly minimized.  The quick reaction to move to cash will have a lasting impact on this client, but he probably won’t notice it until his cash balance is drawn down substantially.

This serves as an example for investors to stick to their plan and avoid making sudden and drastic changes to their investment strategy… and to listen to alternative suggestions from their advisor.

The New Retirement Dream

About 15 years ago, the common retirement dream was to retire early.  It wasn’t uncommon for people in the their late 50s to pull the trigger and retire.  But that trend has been waning over the years.  More and more, we are seeing clients opt to work later in life.  Some find passion jobs that they truly enjoy, such as working for a non profit that supports a cause that they hold dear.  Others become successful entrepreneurs.  Still others, keep their existing job but retool it to better suite themselves, such as working part time or do job-sharing.

It turns out, that our own observations are reflective of several polls and surveys that have been released.  Here are some interesting findings:

  • 3 out of 4 Americans plan to work beyond traditional retirement age
  • 40% of respondents said they plan to retire after age 65
  • 44% of respondents said they would work part-time because they want to (up from 34% in 2013)

If you’re interested in reading more about this growing trend, this article is very interesting.

Annual Returns and Intra-year Declines of the S&P500

Here is an interesting chart I came across that shows just how volatile the stock market can be during the year.  In a year where we have seen relatively little downside volatility in the market, it’s important to remember that there can be some big and sometimes scary corrections in the market.

This chart shows the calendar year returns in grey bars for the S&P 500.  But the interesting take away are the red dots that show the intro-year decline of the index.  Look at 2016, which ended the year up 10%, but was down as much as 11%.

Those “shocking” market corrections and big declines that lead investors to make bad decisions are not unusual.  They are just really scary when we are in the midst of a correction.

The Federal Reserve says one thing, the yield curve the other.

Final 4th quarter GDP came in at 2.1% leaving the 2016 growth rate at 1.6%.  The Atlanta District of the Federal Reserve is predicting less than 1% growth for the 1st quarter of 2017.  That is not good.  Despite this, the Board of Governors of the Federal Reserve in Washington has begun raising short-term interest rates, citing indications of a stronger economy ahead.  However, the yield curve (which plots the interest rates of bonds maturing from now to 30 years out) is telling a different story.  While the short term rates on CD’s and money market rates move with the Fed’s decisions, the interest rate on the 10-year Treasury bond is very important and is driven by real-world activity.  This is the one to watch.  Mortgage rates and other important benchmarks key off of this rate more than the Fed’s position on short-term rates.  The interest rate on the 10-year Treasury bond has risen from a very low 1.4% about a year ago to 2.6% in the past month (remember, the current price of a bond goes up when the interest rate goes down and vice versa). However, the interest rate on the 10-year Treasury bond has started to stall and may well roll over and head back down … not an encouraging sign for increasing economic activity (but good for the current price of many bonds).  Long-term interest rates typically rise with stronger economic activity, but they are lagging.  The yield curve showing longer term interest rates vs. short term rates remains somewhat flat.

The stock market still sees things differently. Stock prices have risen despite years of disappointing earnings (see below “5/16/16: Is Fair Value Obsolete?” ). President Trump’s election has further boosted stock prices due to a hopefully optimistic outlook.

A great deal depends on the effectiveness of our new President’s economic policies and whether they will be implemented or not.  While the stock market may be optimistic, the bond market has not been so inclined to follow suit at this time.  Should the economy continue on its slow growth path similar to the last 8 years or so, interest rates may stay low (or even go lower) perhaps, making bonds a safer place to invest (remember, the current price of  bonds goes up when interest rates go down and vice versa).  Interest rates going  lower when they are already near historic lows seems implausible but possible.

How to Retire Real, Real, Real Early

The “Retire in your 30’s concept” has been gaining some traction these last few months.  There are a lot of success stories being shared from others about how they have been able to retire early.  From time to time, I find one that is particularly interesting and want to share it.

JP Livingston is 28 years old.  She has been saving about 70% of her take home pay and investing it. Over the last 10 years or so, she has been able to amass about $2 million by socking money away and living well below her means.  No secret tricks.  No get rich quick schemes.  She was disciplined enough to save.  What makes this story unique is that she did this while living in NYC!

Check out her story here